Ratio data is one of only 4 types of data in statistics.
Do you know what they all are and what you can do with them?
If you want to know everything there is to know about Ratio data - definitions, examples, analysis and statistics - then you're in the right place.
When you're done here, you'll also want to read this post's sister articles on quantitative data and qualitative data, Nominal data, Ordinal data and Interval data.
For now, though, here is our guide to Ratio data and how to deal with them...
More...
Disclosure: we may earn an affiliate commission for purchases you make when using the links to products on this page. As an Amazon Affiliate we earn from qualifying purchases.
This post forms part of a series on the 4 types of data in statistics.
For more detail, choose from the options below:
4 Types of Data in Statistics: Introduction
What is Ratio Data?
If you want a simple definition of Ratio data, it would be this:
Ratio Data Definition
Ratio data is measured numerical data that has equal distances between adjacent values and a meaningful zero
Ratio data is the data type in statistics that has the following characteristics:
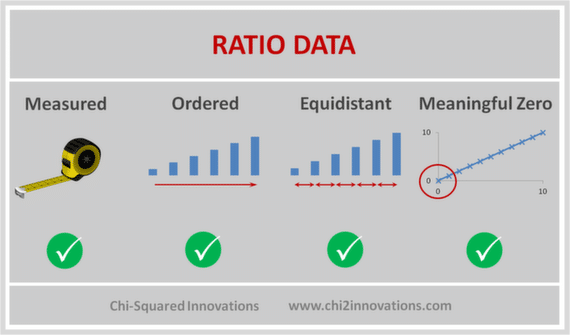
Ratio Data are measured and ordered with equidistant items and a meaningful zero
As with Interval data, Ratio data can be continuous or discrete, and differs from Interval data in that there is a non-arbitrary zero-point to the data. In other words, Interval data can take negative values, whereas Ratio data cannot be negative.

Pin it for later
Need to save this for later?
Pin it to your favourite board and you can get back to it when you're ready.
Ratio Data Examples
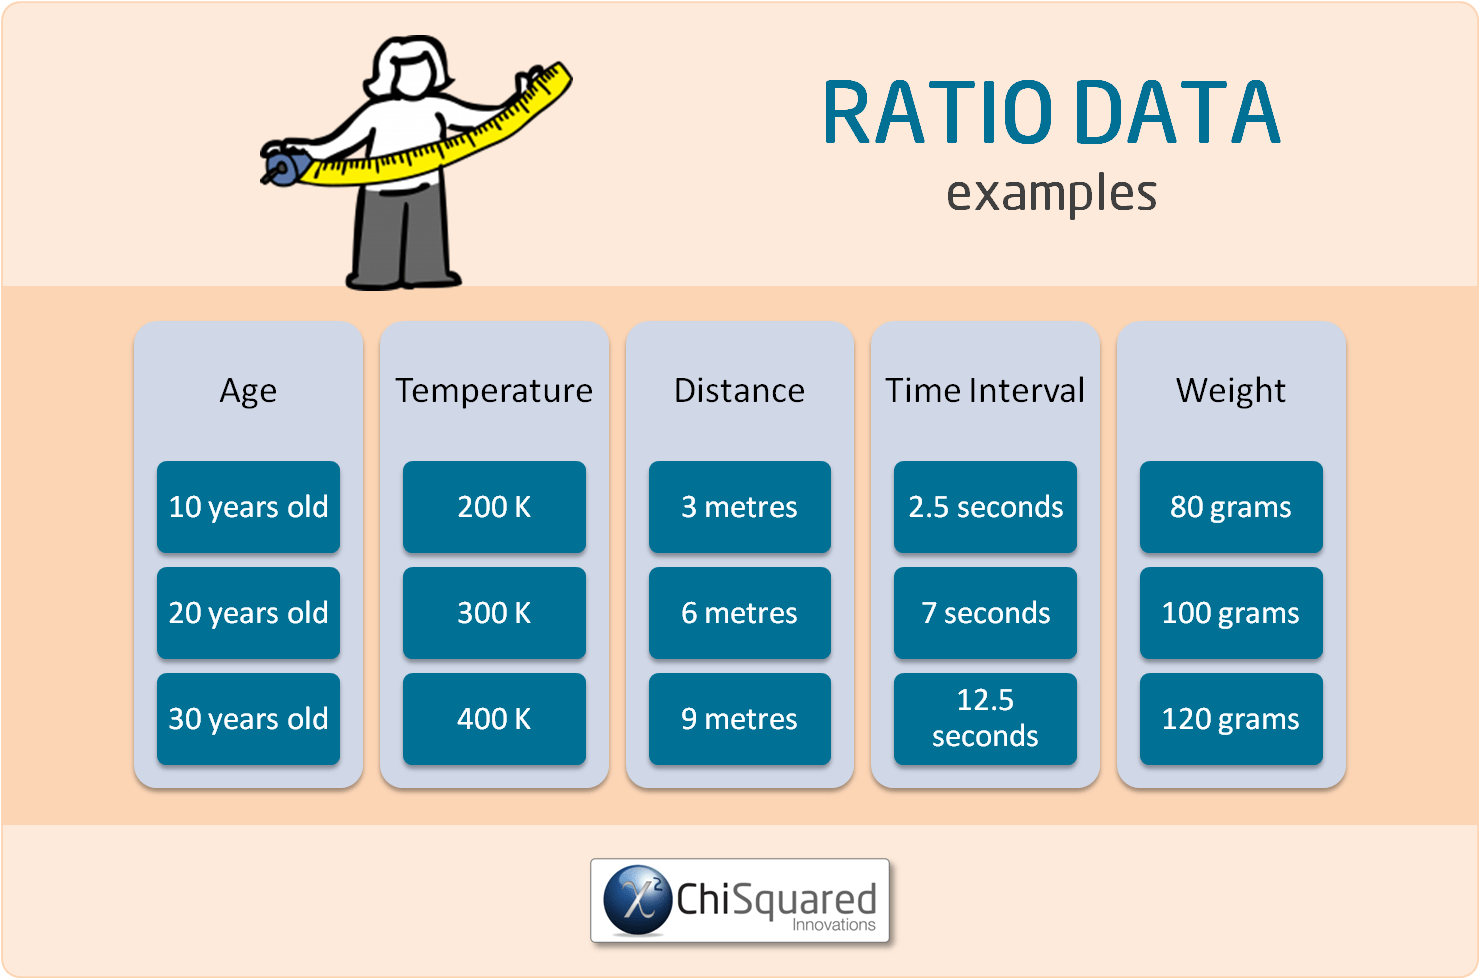
Examples of Ratio data include:
For each of these examples of Ratio data there is a real, meaningful zero-point. The age of a person, absolute zero, distance measured from a pre-determined point or time all have real zeros.
3 Simple Questions...
What's Stopping You Reaching
YOUR Data Ninja Potential?
Answer 3 questions and we'll recommend the best route to
super-charge your data career
With real zero-points we can multiply and divide the numbers - a 6 year old is half the age of a 12 year old and matter at 100K has half the energy of matter at 200K. Similarly, the distance from Barcelona to Berlin is half the distance as Barcelona to Moscow, and it takes me twice as long to run the 100m as Usain Bolt but only half the time of my Grandad.
In the examples of Ratio data above, can you see why Temperature measured in °C or F are examples of Interval data, whereas Temperature measured in Kelvins is an example of Ratio data? [Hint: zero Kelvins is also known as Absolute Zero]
What Can You Calculate With Ratio Variables?
When Ratio data are used in analysis, they are called Ratio Variables, so that's what we'll call them from here.
With Ratio variables, all cards are on the table. You can compare the data (equal or not), you can sort the values (greater/less than), add/subtract them, and you can also multiply or divide them.
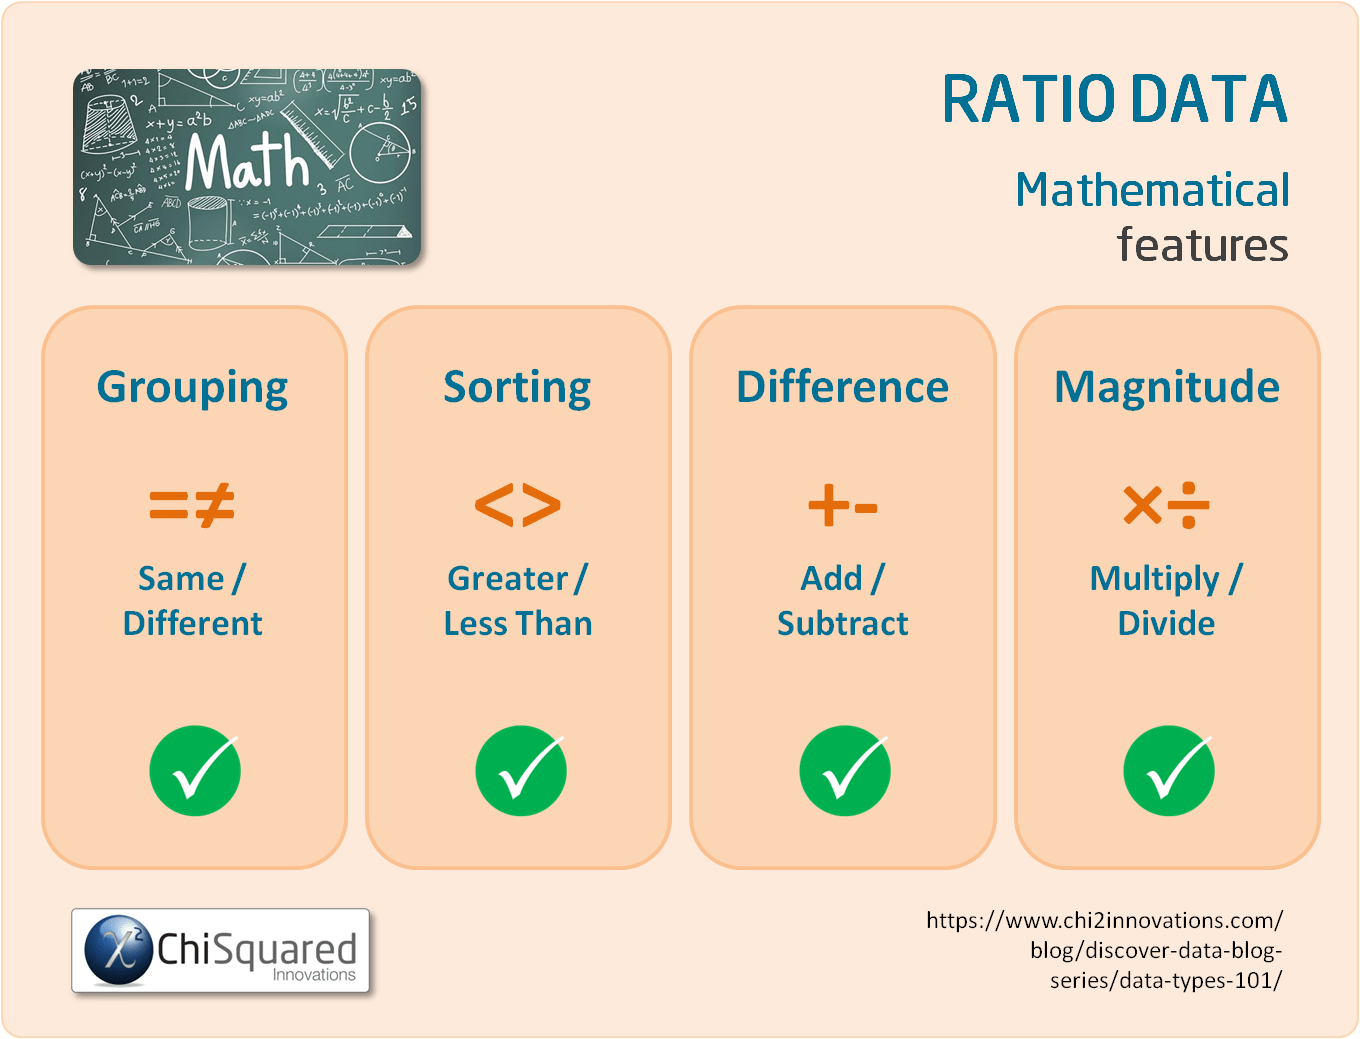
For example, with Ratio variables you can check whether your apples weigh the same, you can sort them from heaviest to lightest and you can calculate the differences in their weights.
With Ratio variables you can also multiply and divide your numerical data, so you can calculate the ratios of their weights and say things like 'this 100 gram apple weighs twice as much as this 50 gram apple'.
The ability of Ratio data to be multiplied and divided is really important, because you can use Ratio variables to derive new variables.
For example, if you want to calculate your Body Mass Index (BMI) you need to divide your weight by your height multiplied by itself, (BMI = weight divided by height squared).
Learn More About Statistics and Data with These Books:
What Descriptive Statistics Can You Do With Ratio Variables?
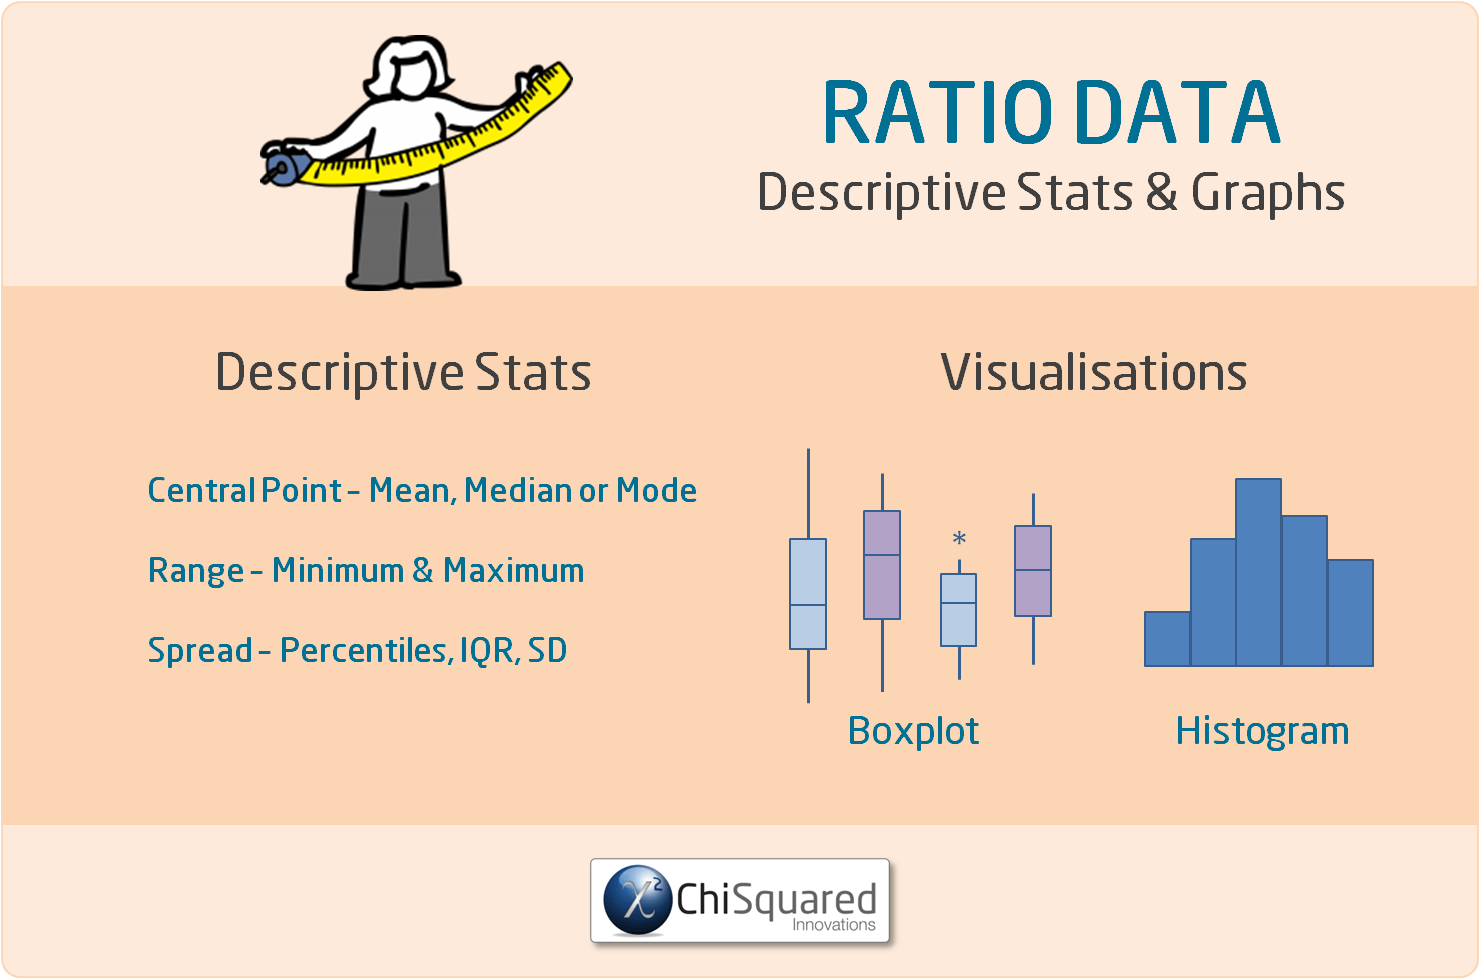
With Ratio variables you can calculate precisely the same things as you can with Interval variables. That is:
Ratio Data - What Is It, And How Do You Analyse It? Everything You Need To Know (And More) @chi2innovations #dataanalytics #datatypes #statistics
What Data Visualisations Can You Do With Ratio Data?
As with Interval data, to visualise Ratio data, you can use a boxplot or a histogram. Check the central point and variability with a histogram, and check the boxplot to see if you have any outliers.
When it comes to analysing your data, there is little practical difference between Interval and Ratio data. Whichever statistical tests are appropriate for Interval data are also good for Ratio data.
What Statistics Can You Do With Ratio Variables?
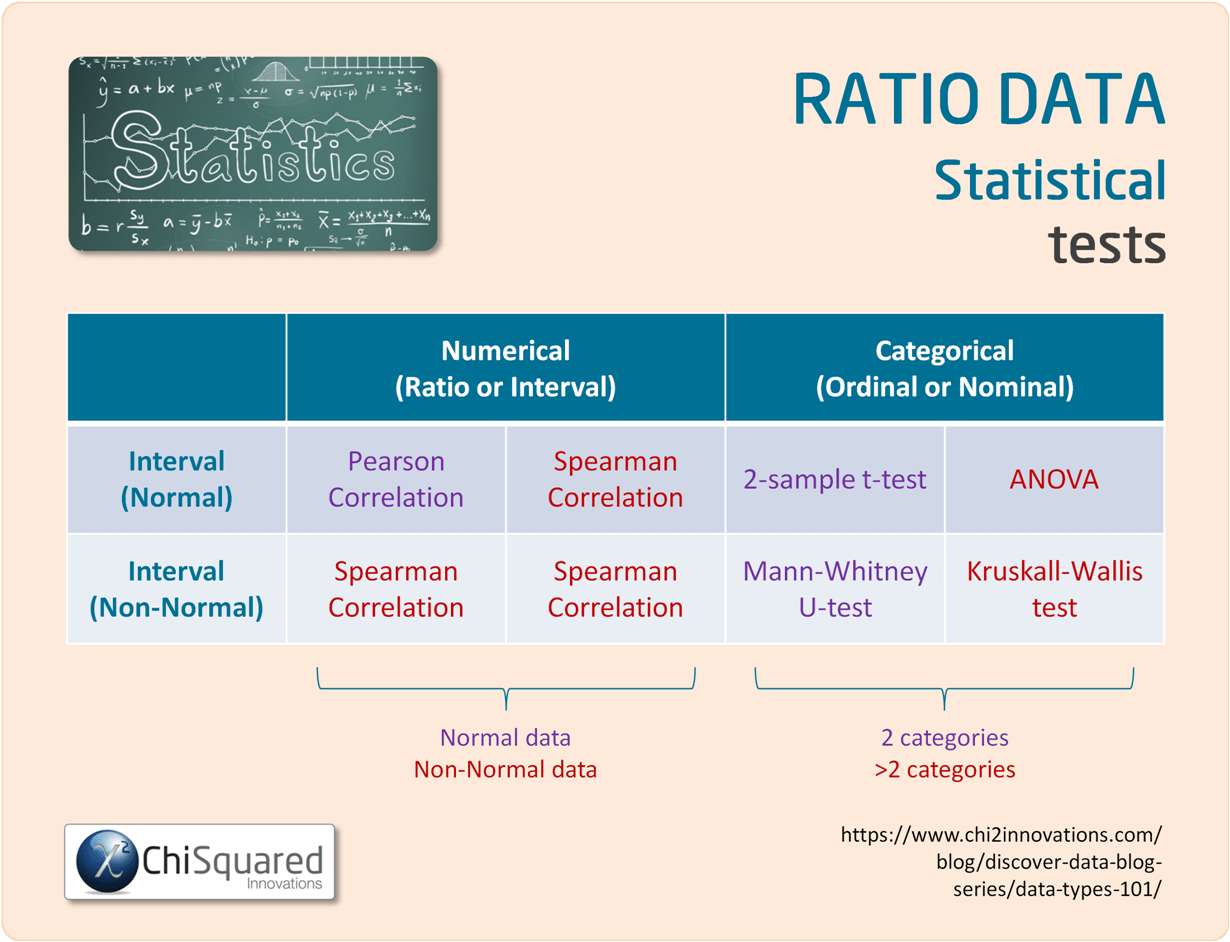
Ratio variables can be used in exactly the same statistical hypothesis tests as Interval variables. Statistically speaking, there is no difference between Ratio variables and Interval variables - you deal with them both in the same way.
Examples of statistical tests that use Ratio variables are the ANOVA, Student's t-test, Pearson correlation and simple linear regression.
Interval vs Ratio Data - What is the Difference?
Both Ratio data and Interval data are quantitative data (numerical data).
The only difference between them is that while both Ratio data and Interval data have equal spacing between adjacent values (so you can add and subtract their values), only Ratio data have a true zero.
That is, Interval data can take negative values, whereas Ratio data cannot - and this means that Ratio data can be multiplied and divided, but Interval data cannot.

UNIQUE VIDEO COURSE
In less than 2 hours
your data can be:
Ratio Data: Summary
The basics of statistics, like data collection, data cleaning and data integrity aren't sexy, and as a result are often neglected, and that is also the case with data types.
In my experience, few people that have to do statistics as part of their research know and understand the statistical data types, and as a result struggle to get to grips with what they can and can't do with their data.
That's a shame, because as you've seen, if you know the 4 types of data in statistics you know:
In short, data types are a roadmap to doing your entire study properly.
They really are that important!
Hopefully, by now you have a good understanding of what Ratio data are, and what you can do with them.
Ratio Data are measured and ordered with equidistant items and a meaningful zero. Ratio data can be sorted, added and subtracted, but can also be multiplied and divided.
Ratio data are types of Quantitative data (also known as numerical data).
When it comes to analysing data, Ratio data are the best to deal with mathematically (note that I didn't say easiest...) because all possibilities are on the table. You can find the central point of the data by using any of the mode, median or mean (arithmetic, geometric or harmonic) and use all of the most powerful statistical methods to analyse the data. As long as you choose correctly you can be really confident that you are not being misled by the data and your interpretations are likely to have merit.
Now that you know everything there is to know about Nominal data, you might also like to read this post's sister articles on quantitative data and qualitative data, Nominal data, Ordinal data and Interval data.
Do you have any questions about Ratio data? Is there something that I've missed out?
Let me know in the comments below - your feedback will help me to improve the post and make learning about data and statistics easier for everybody!
In the next posts we'll compare each of the 4 types of data and I'll also show you how to choose the correct statistical hypothesis test.
This post forms part of a series on the 4 types of data in statistics.
For more detail, choose from the options below:

