Interval data is one of only 4 types of data in statistics.
Do you know what they all are and what you can do with them?
If you want to know everything there is to know about Interval data - definitions, examples, analysis and statistics - then you're in the right place.
When you're done here, you'll also want to read this post's sister articles on quantitative data and qualitative data, Nominal data, Ordinal data and Ratio data.
For now, though, here is our guide to Interval data and how to deal with them...
More...
Disclosure: we may earn an affiliate commission for purchases you make when using the links to products on this page. As an Amazon Affiliate we earn from qualifying purchases.
This post forms part of a series on the 4 types of data in statistics.
For more detail, choose from the options below:
4 Types of Data in Statistics: Introduction
What is Interval Data?
If you want a simple definition of Interval data, it would be this:
Interval Data Definition
Interval data is measured numerical data that has equal distances between adjacent values, but no meaningful zero
Interval data is the data type in statistics that has the following characteristics:
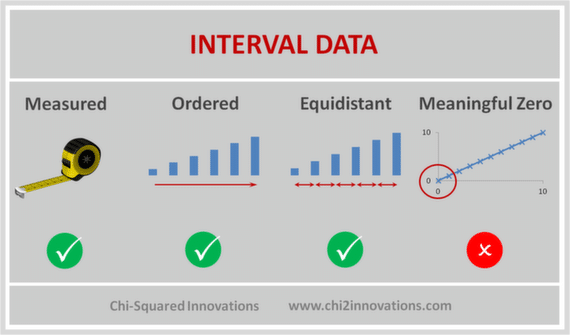
Interval Data are measured and ordered with equidistant items, but have no meaningful zero
Interval data are ordered, can be continuous (have an infinite number of steps) or discrete (organised into categories), and the degree of difference between items is meaningful (their intervals are equal), but not their ratio.
The key points of an Interval scale is that the word 'interval' means 'space inbetween', which is the important thing to remember - interval scales not only tell us about order, but also about the value between each item.

Pin it for later
Need to save this for later?
Pin it to your favourite board and you can get back to it when you're ready.
Interval Data Examples
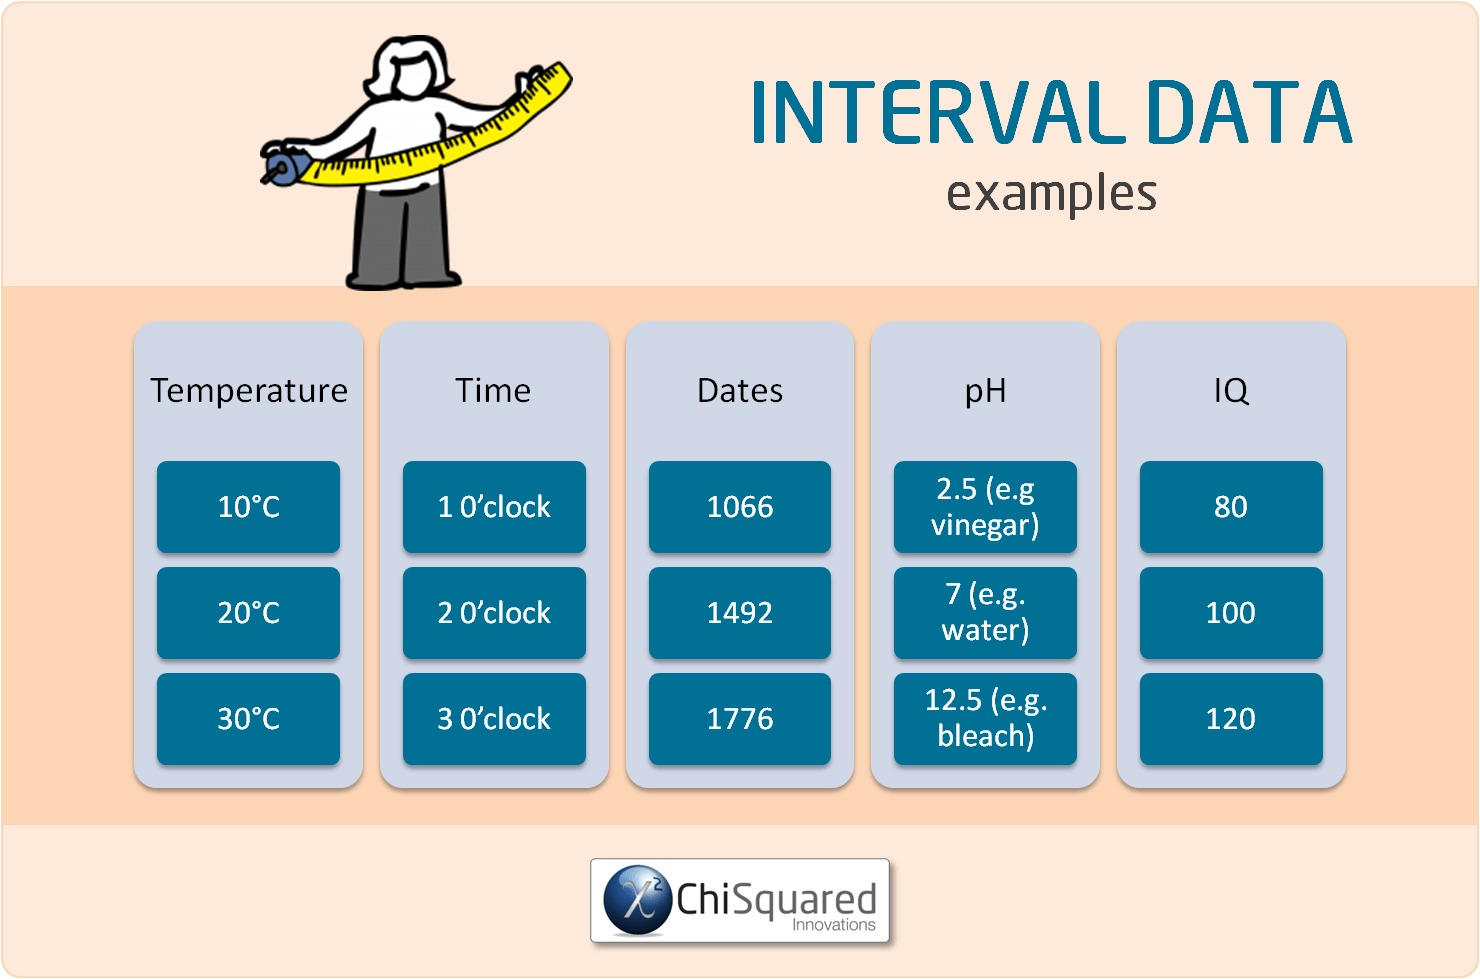
Examples of Interval data include:
Crucially, Interval data can be negative, whereas Ratio data cannot.
Although Interval data can appear very similar to ratio data, the difference is in their defined zero-points. If the zero-point of the scale has been chosen arbitrarily (such as the melting point of water or from an arbitrary epoch such as AD) then the data cannot be Ratio data and must be Interval data.
In the examples of Interval data above, can you see that there is not a meaningful zero point to any of them? Can you see that when you reach zero you can keep going?
What Can You Calculate With Interval Variables?
When Interval data are used in analysis, they are called Interval Variables, so that's what we'll call them from here.
With Interval variables you can compare the degrees of the data (equality/inequality, more/less) and you can also add/subtract the values.
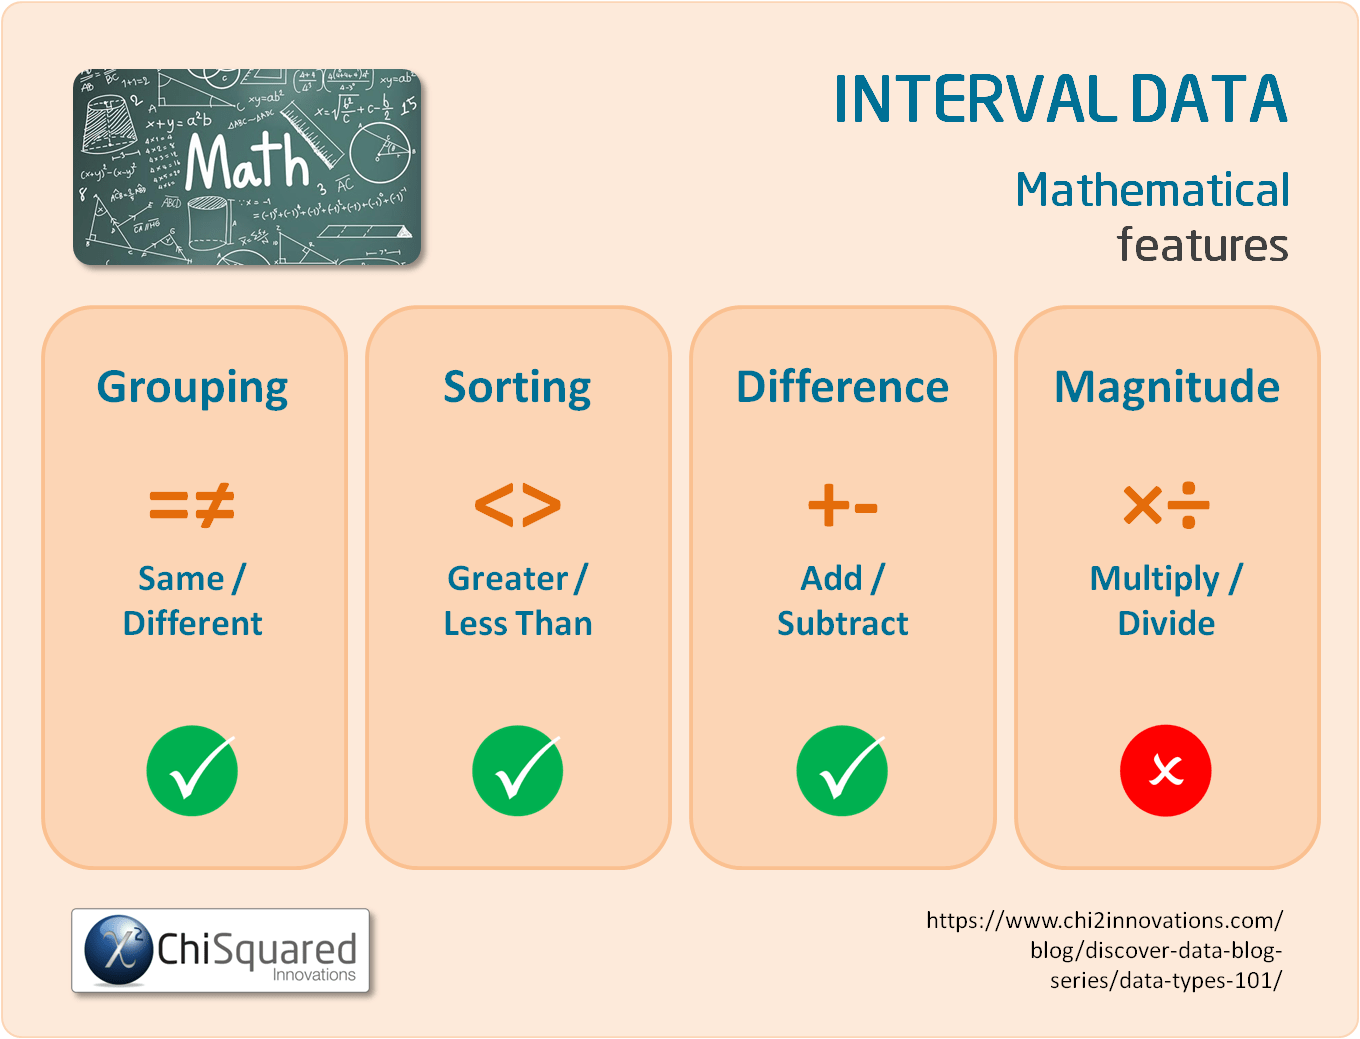
For example, with Interval variables you can say things such as '28°C is 8 degrees hotter than 20°C' (28 - 8 = 20) or '6pm is 4 hours later than 2pm' (2 + 4 = 6).
However, you cannot multiply or divide the numbers because of the arbitrary zero, so you can't say 'a person with an IQ of 150 is 3 times as smart as a person with an IQ of 50' or '6pm is twice as late as 3pm'.
3 Simple Questions...
What's Stopping You Reaching
YOUR Data Ninja Potential?
Answer 3 questions and we'll recommend the best route to
super-charge your data career
What Descriptive Statistics Can You Do With Interval Variables?
As Interval variables are quantitative data (continuous data), the descriptive statistics for these are very different to those for qualitative data.
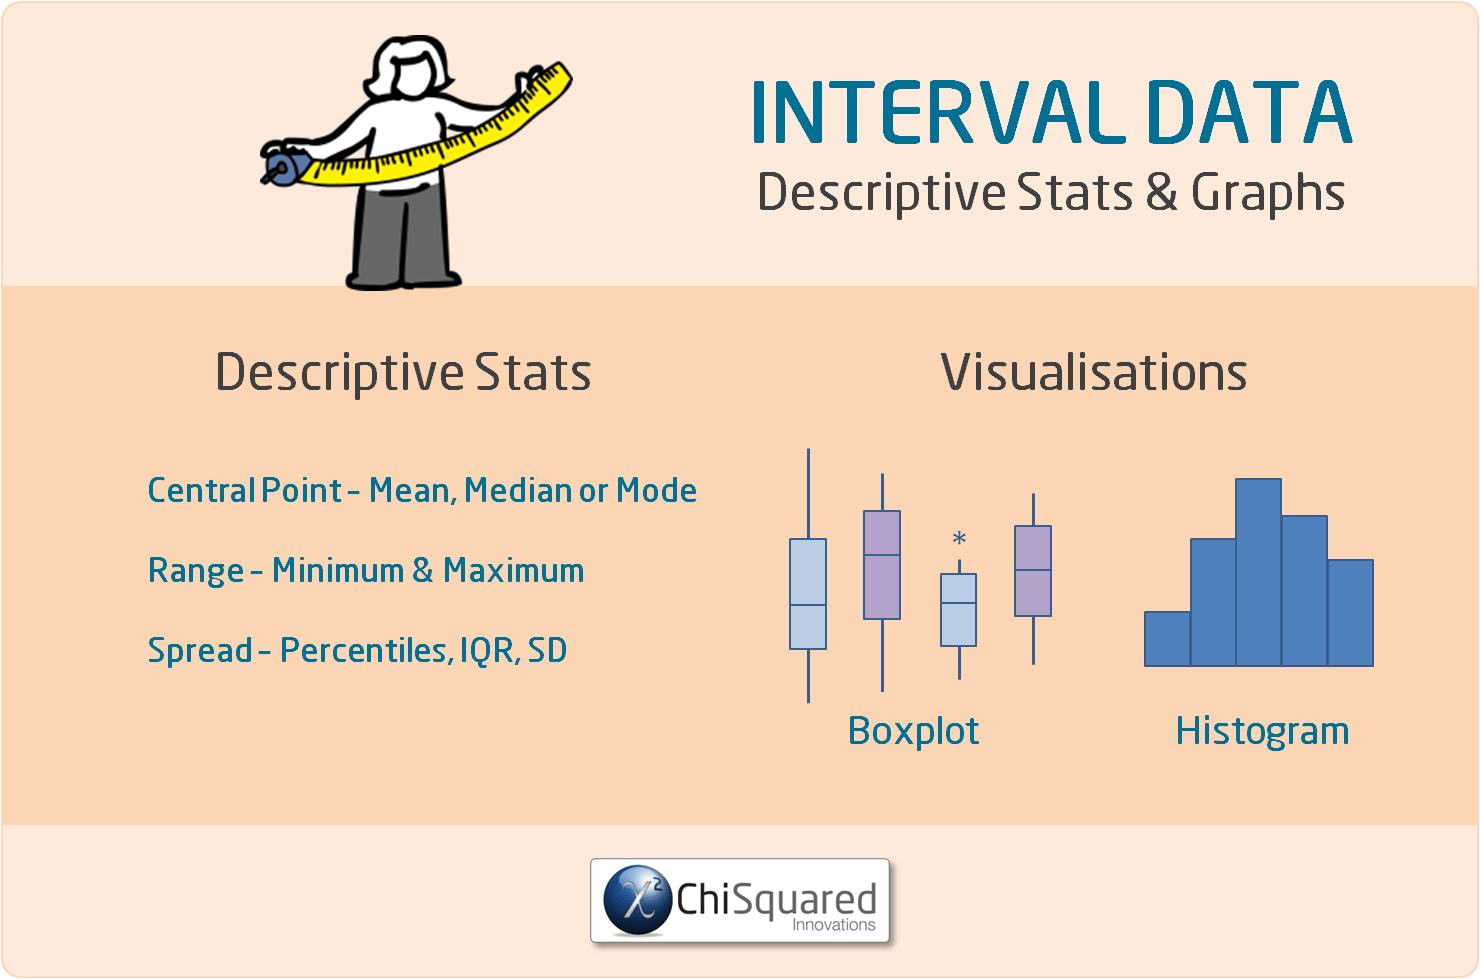
The central value of Interval variables is typically the mean (but could be the median or mode). You can also express the spread or variability of the data using measures such as the range, standard deviation, variance and/or confidence intervals.
Interval Data - What Is It, And How Do You Analyse It? Everything You Need To Know (And More) @chi2innovations #dataanalytics #datatypes #statistics
In summary, the descriptive statistics you can calculate for Interval variables are:
Learn More About Statistics and Data with These Books:
What Data Visualisations Can You Do With Interval Variables?
To visualise Interval variables, you can use a boxplot or a histogram. You can check the central point and variability with a histogram, but you'll need to check the boxplot to see if you have any outliers. This is why you should visualise Interval variables with both a boxplot and a histogram.
What Statistics Can You Do With Interval Variables?
Once you start to work with numerical data rather than categorical data, you'll find that the statistical hypothesis tests are more powerful and you can have more confidence in their results.
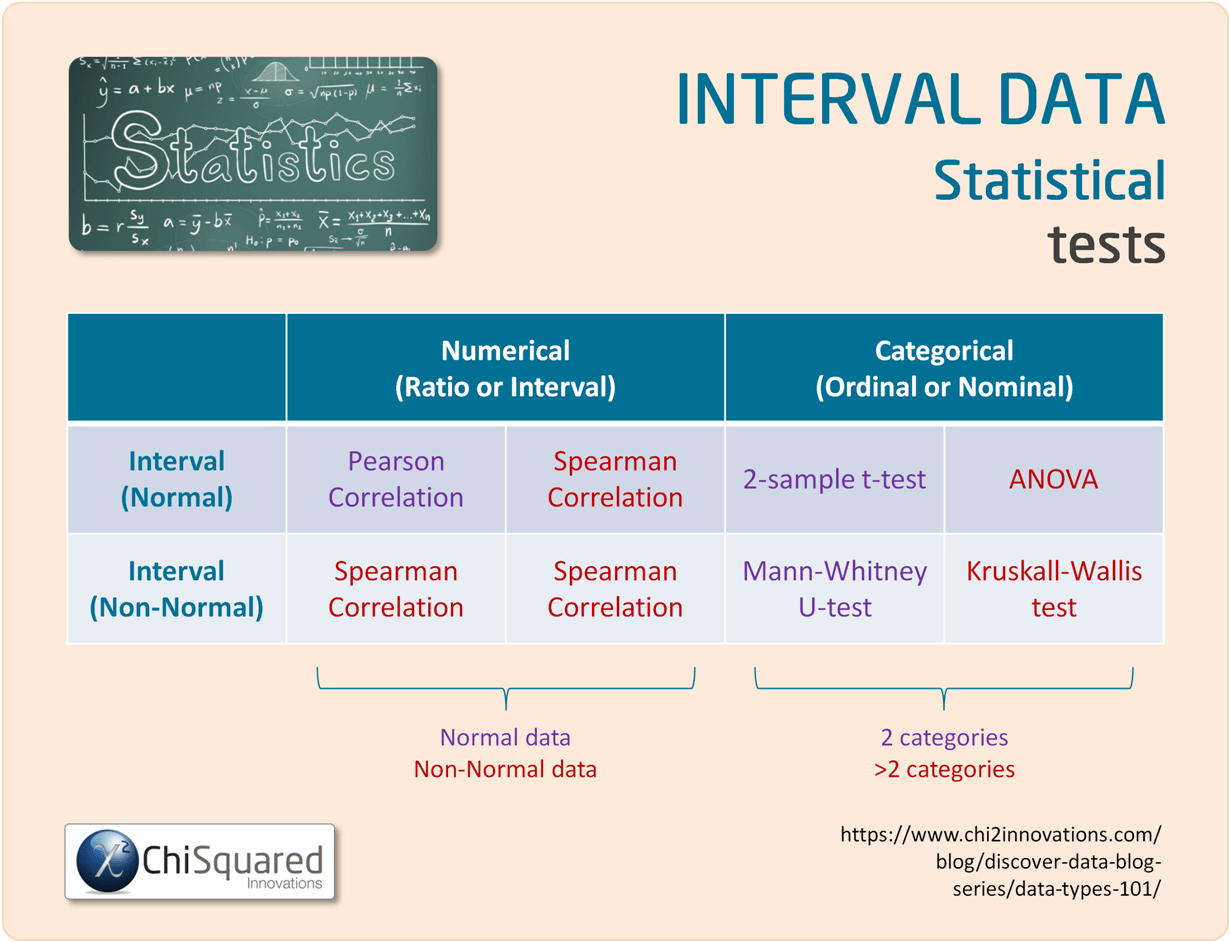
Interval variables are often used in statistical hypothesis tests such as the Student's t-test (aka the 2-sample t-test) and the ANOVA (categorical data), and in correlations such as the Pearson correlation and Spearman correlation (numerical data).
Interval vs Ratio Data - What is the Difference?
Both Ratio data and Interval data are quantitative data (numerical data).
The only difference between them is that while both Ratio data and Interval data have equal spacing between adjacent values (so you can add and subtract their values), only Ratio data have a true zero.
That is, Interval data can take negative values, whereas Ratio data cannot - and this means that Ratio data can be multiplied and divided, but Interval data cannot.

UNIQUE VIDEO COURSE
In less than 2 hours
your data can be:
Interval Data: Summary
The basics of statistics, like data collection, data cleaning and data integrity aren't sexy, and as a result are often neglected, and that is also the case with data types.
In my experience, few people that have to do statistics as part of their research know and understand the statistical data types, and as a result struggle to get to grips with what they can and can't do with their data.
That's a shame, because as you've seen, if you know the 4 types of data in statistics you know:
In short, data types are a roadmap to doing your entire study properly.
They really are that important!
Hopefully, by now you have a good understanding of what Interval data are, and what you can do with them.
Interval Data are measured and ordered with equidistant items, but have no meaningful zero. You can sort Interval data and you can add and subtract their values.
Interval data are types of Quantitative data (also known as numerical data).
Now that you know everything there is to know about Interval data, you might also like to read this post's sister articles on quantitative data and qualitative data, Nominal data, Ordinal data, and Ratio data.
In the final posts we'll compare each of the 4 types of data and I'll also show you how to choose the correct statistical hypothesis test.
Do you have any questions about Interval data? Is there something that I've missed out?
Let me know in the comments below - your feedback will help me to improve the post and make learning about data and statistics easier for everybody!
This post forms part of a series on the 4 types of data in statistics.
For more detail, choose from the options below:

