Let’s say you have collected your data and have a nice, clean dataset. You’re ready to start doing your analysis.
Hold on there cowboy, not so fast.
You wouldn’t start building your house without putting the foundations in place, would you? The last thing you need is for all your hard work to come crashing down because you didn’t take the time to make sure that the bricks are laid on solid ground.
The first thing you need to do is get to know your data before you can start to analyse it. I know what you’re thinking – descriptive statistics, right? Wrong!
More...
The first step is to take a look at each variable and decide which data type they belong to. From here, this will tell you which mathematical operations you can and can’t do with these data. This might not sound sexy, but over the years I’ve found that this step is one that most researchers omit in their study – and pretty much every one of them regrets it later.

Pin it for later
Need to save this for later?
Pin it to your favourite board and you can get back to it when you're ready.
Disclosure: This post contains affiliate links. This means that if you click one of the links and make a purchase we may receive a small commission at no extra cost to you. As an Amazon Associate we may earn an affiliate commission for purchases you make when using the links in this page.
You can find further details in our TCs
So here we’re going to take a look at the different data types, learn to understand them and do calculations with them. By the time you’ve got to the end I hope you’ll be able to put your new found knowledge into practice in your data – and impress your boss with it!
1. Know Your Data
Did you know that there are 4 distinct data types? You might have done, and you might even be able to name them. If you can, well done – you’re way ahead of most people.
Over the years I’ve taught hundreds of researchers how to process their data, and very few of them know all 4 data types. For the record, here they are:
- Ratio
- Interval
- Ordinal
- Nominal
If you didn’t know them, their names might give you a clue what they are and what you can do with them.
Let’s start from the top and work down the list.
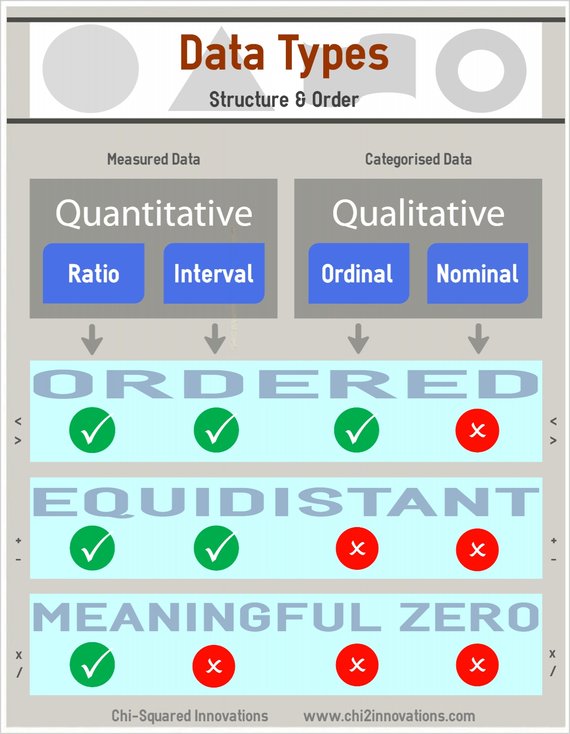
I’ve created a useful infographic that you might find useful to refer to as we go along. Note the mathematical symbols in the margins - they'll help you understand what operations you can do with your data.

Infographic: Quantitative Data is measured, Qualitative Data is categorised
Ratio Data
These data are called Ratio because you can divide their values. That doesn’t make much sense – perhaps an example will help.
Distance or weight measurements are Ratio because you can divide their values to get a meaningful answer. Here are some examples:
- 20 metres is twice the distance of 10 metres (i.e. 20/10 = 2)
- 50 kg is ten times heavier than 5 kg (i.e. 50/5 = 10)
- 150K has half the amount of energy as 300K (i.e. 150/300 = ½)
With Ratio data, you can do pretty much any mathematical operation to them and the result will be valid. You can:
- Divide
- Multiply
- Add
- Subtract
- Compare (greater than, equal to or less than)
It is important to note that Ratio data can be used in a division along with other Ratio data. For example, Body Mass Index – a very simple measure of body fat – is calculated as the ratio of the weight to the square of the height. The weight and height are both Ratio data, as is the resultant BMI.
The crucial point about this is that for values to be divisible there needs to be a meaningful zero point to the data. A tape measure can’t make negative measurements and neither can a jug or a set of weighing scales, so anything measured by these has an absolute zero and can take only positive values – negative numbers are not allowed.
Interval Data
With Interval data, we take a single step backwards from Ratio data in that all possibilities are on the table, with the exception that you cannot multiply or divide. What you can do, though, is add and subtract. Here are some examples:
- 4pm is 2 hours after 2pm (i.e. 4 - 2 = 2)
- 50°C is 30 degrees hotter than 20°C (i.e. 50 - 30 = 20)
- My test score of 80% was higher by 20% than your score of 60% (i.e. 80 - 20 = 60)
We can’t multiply or divide any of these examples, because there is no meaningful zero, so we can’t say things like ‘4pm is twice as late as 2pm’, ‘100°C is twice as hot as 50°C’, or ‘you only scored 40% – my score of 80% means that I’m twice as intelligent as you’. Midday, the melting point of water and test scores do not have true zero-points.
With Interval data, you can do the following mathematical operations:
- Add
- Subtract
- Compare (greater than, equal to or less than)
Interval and Ratio data can often be difficult to distinguish from each other. They are both measured quantities and are continuous (measurements with decimal points are valid). The difference, though, is in whether or not there is a meaningful zero – in other words, whether negative numbers are possible. For height, weight, time measured by a stopwatch and temperature on the Kelvin scale, there is a real zero-point, so they are all Ratio data. On the other hand, time measured on a 12- or 24-hour scale, temperature measured on any scale other than in Kelvins, and test scores do not have meaningful zeros, so they are all Interval data.
Practical Data Cleaning

Practical Data Cleaning explains the 19 most important tips about data cleaning to get your data analysis-ready in double quick time.
Discover how to clean your data quickly and effectively. Get this book, TODAY!
Ordinal Data
The name says it all really – with Ordinal data, the data are in categories that have a natural order. What is important, though, is that the difference between each category cannot be quantified, so what you can do with Ordinal data is:
- Compare (greater than, equal to or less than)
That’s all. Nothing else. We can say that a Scotch Bonnet pepper is hotter than a Cayenne pepper (rating at 100,000 and 10,000 on the Scoville scale), but we can’t subtract their Scoville measurements because degrees of ‘hotness’ are not meaningful. That would be like saying that you need to eat 90,000 Cayenne peppers to get the same effect as eating zero Scotch Bonnets, and that would just be silly.
Examples of Ordinal data are:
- Rankings (i.e. 1st, 12th, 52nd, etc.)
- Agreement (i.e. Agree, Neutral, Disagree)
- Epochs (i.e. Cretaceous, Jurassic, Triassic, or Morning, Afternoon, Evening)
- Socioeconomic status (i.e. Lower, Middle, Upper)
Nominal Data
Finally, with Nominal data, all you can do is name the categories. There is nothing else you can do; no multiplication or division, no addition or subtraction, not even a simple comparison. Each Nominal category is different, but you can’t define mathematically why they are different (there may be many reasons) and there is no order in the categories.
Examples include:
- Gender (i.e. Male, Female, Other)
- Religion (i.e. Buddhist, Hindu, Jedi)
- Genotype (i.e. BB, Bb, bB, bb)
- Hair colour (i.e. Black, Brown, Blonde, Red, Other)
Ordinal and Nominal data are similar in that their data are observed (not measured) and placed in categories, but the difference is in whether the categories are ordered.
It is really important to identify for every variable in your dataset which data type it belongs to. Once you’ve done that you will then know which calculations are possible with each variable, which is where we’re going next.
Here's a guide about the 4 Types of Data in Statistics, if you need to learn what you can and can't do with them.
2. Make Your Data Calculations
When you’ve collected and cleaned your data, you’re only part way to having an analysis-ready dataset. Typically, about half the data you need for your analysis are collected (like Height, Weight, Gender), but the other half needs to be calculated (like Age, BMI, Time to Event).
This is where your knowledge of data types comes in handy. If a variable is labelled as Ordinal, then you can’t multiply or divide, add or subtract, so if that’s what you planned to do, then there’s something wrong somewhere. Go and find out what!
For example, say you need to calculate the Age of patients in a dataset. You will typically calculate Age as the date that you started your study minus their date of birth. What type of data will Age be? It should be Ratio, which means that the dates you use to calculate it must also be Ratio. Unfortunately, dates are not of type Ratio, they are Interval data because there is no meaningful zero point.
Oh dear…
Actually, it’s not a problem, because the date of birth defines a meaningful zero, so in this case taking the difference between dates creates a meaningful zero and the resultant data become Ratio.
This is what I mean when I say that you should know and understand your data types and what you can and – more importantly – cannot do with them.
Ratio data can be divided (e.g. Age - I am half the age of my father) and Interval data cannot (e.g. dates - you cannot divide dates), but in some circumstances Interval data can be converted to Ratio data so that division and multiplication become possible.
OK, so now we’ve got that sorted and we understand our data types, we need to know the types of calculations that we’re likely to face in our data, and there are 5 basic types:
- Create new variables by multiplication and division
- Create new variables by addition and subtraction
- Summarise continuous data in integer categories
- Convert integer data to text categories
- Convert text data to integer categories
If you’re not sure what these mean, don’t worry - I'm going to explain them now.
Create new variables by multiplication and division
At times we need to multiply or divide variables to create new variables. Examples include BMI, which is Weight divided by the square of the Height.
As mentioned, all variables must be of Ratio type, and the outcome will also be Ratio. Ask yourself if this is true with your data. Is it sensible or will you get an answer that just doesn’t make sense?
Learning how to multiply and divide in Excel is easy enough, and you can do things like:
- = 100 * A2 * B2 / C2
- = 100 * (A2 * B2)/C2
- = PRODUCT(A2:B2, 100)/C2
All these equations produce the same answer, so you can see how in Excel there are usually lots of different paths to reach your destination.
Create new variables by addition and subtraction
Some data needs to be added or subtracted to create new variables. As mentioned above, the difference between dates is an example in which the outcome is of Ratio type, but it may not always be. Again, ask yourself what type of data the outcome is and what you can and cannot do with it. When you’ve decided, make a note in your lab book or in Excel.
Addition and subtraction computations in Excel are pretty simple, and all the following equations are equivalent:
- = 57 + A2 + B2 - C2
- = 57 + SUM(A2:B2) - C2
- = SUM(A2:B2, 57 ,-C2)
Summarise continuous data in integer categories
Sometimes continuous data (Ratio or Interval) contains bias, noise, or estimated figures. Examples include asking a lady her precise age or asking a fisherman the weight of his biggest catch – you’re not always going to get a truthful answer! When you suspect your continuous data is not as accurate as you would like it to be, it may be useful to summarise your data into categories. In doing this, you will remove some or all of the bias and noise, but you will also usually lose some of the detail in your information. You need to decide whether the trade-off is worth it.
Also, don’t forget that you can have it both ways – you can keep your original data and summarised data, then analyse both sets. It may be more work, but you’ll gain a deeper understanding of your data, which is never a bad thing.
Oh yes, and your continuous data that started out as Ratio or Interval has now been converted into Ordinal. You can no longer do any mathematical calculations with it!
Summarising continuous data as categories in Excel can be achieved in a number of ways depending on your data and what you need to do with it. For example, you might want to summarise Age as integers. To achieve this you’ll need to round the Ages down to the nearest decade, then divide by 10, so that ages 25, 68 and 74 become categorised as 2, 6 and 7. For this, the following equation might be useful:
- =ROUNDDOWN(B2, -1)/10
Convert integer data to text categories
There may be times when, on summarising your continuous data into integer categories, you realise that the counts in some of the categories are too small for meaningful analysis. For example, you might summarise Age into decade categories, so for example 2, 3 and 4 represent patients in their twenties, thirties and forties. It might be more useful to summarise your integer categories into broader categories, such as Juvenile, Pre-Menopausal, Post-Menopausal, or whatever is most useful for your study. Representing these categories with text labels rather than integers might be more useful and informative.
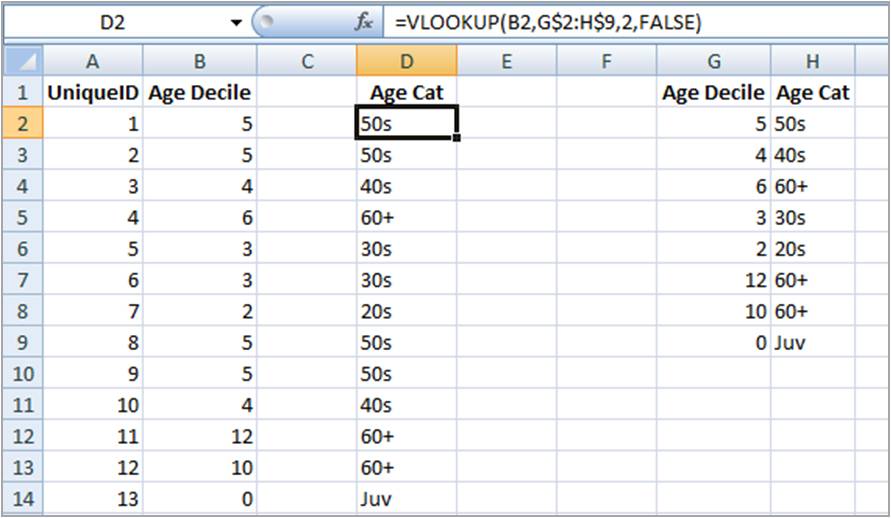
When we’re converting data from one form to another the computation starts to get more complex. That doesn’t mean that it’s any more difficult, though. You just need a little more awareness of how to go about it. There are lots of different ways of tackling this, and some are easier than others, but I recommend creating a Translation Matrix, which is a table that defines all the categories that you have and all those that you need, like this:

Basically this is 3-step process. First you need to create a list of all the categories that exist in your variable. Before you run off and start typing, we’re going to be doing this using Excel tools, not by doing things manually.
In the first step, you make a copy of your data column (in column G in the image above). Then you apply Remove Duplicates to get a unique list of all the categories.
The second step is in deciding what you want each of these categories to be translated to. When you’ve decided, type them in the adjacent cells (column H).
Finally, you use VLOOKUP to translate your data according to the rules in your Translation Matrix, like this:
- =VLOOKUP(B2, G$2:H$9, 2, FALSE)
And your data has been magically transformed, like this:

Convert text data to integer categories
Now that you have your categories suitably named in Excel and you’re ready to analyse your data, you suddenly realise that your favourite stats program doesn’t support text categories! Oh dear, you’ve now got to convert it back from text to integers, from, say, [Small, Medium, Large] to [1, 2, 3].
Transforming text data to integer categories is exactly the same as in the previous example; you just use Remove Duplicates to get a unique list, build your Translation Matrix, then use VLOOKUP.
To avoid re-doing this for every new column of data, just set it up in a spare worksheet and every time you need to do this operation you clone the worksheet and work in the clone. This way you can transform your data from one form to another in a matter of seconds. It couldn’t be simpler!
3. Check That Your Data are Sensible
Real life follows rules, and so must your data. If you have stored your data in Excel there may be errors in your data that Excel cannot detect, such as when a patient’s Age is negative or over 300. Unless you tell Excel what to expect, it won’t be able to tell you when a piece of data is OK for Excel but not OK for real life.
One way (but not the only way) to check whether your data are sensible is to compute descriptive statistics on each variable, and you should do this for both continuous (Ratio and Interval) and categorical (Ordinal and Nominal) data types.
Descriptive statistics for continuous data
As a minimum, here are the measures you’ll need for continuous data (Ratio and Interval), along with their Excel formulae:
- Maximum and Minimum
- =MAX(range)
- =MIN(range)
- Mean and Standard Deviation
- =AVERAGE(range)
- =STDEV(range)
- Number of cells containing zeros, positive and negative numbers
- =COUNTIF(range, 0)
- =COUNTIF(range, ">" & 0)
- =COUNTIF(range, "<" & 0)
- Number of empty cells
- =COUNTBLANK(range)
- Total Count
- =COUNT(range)
Notice which types of mathematical operations we compute here – we include the mean and standard deviation, which can only be computed with Ratio and Interval data. We also count the number of cells containing negative numbers, which is critical for Ratio data (there shouldn’t be any).
Descriptive statistics for categorical data
Here are the measures you’ll need for getting an understanding of your categorical data:
- Number of cells containing zeros, positive and negative numbers
- =COUNTIF(range, 0)
- =COUNTIF(range, ">" & 0)
- =COUNTIF(range, "<" & 0)
- Number of empty cells
- =COUNTBLANK(range)
- Total Count
- =COUNT(range)
- Number of cells for each category
- =COUNTIF(range, "Category Name")
Whether your categories are named (text) or numbered (integers), these are the measures that will allow you to spot something in your data that isn’t quite right.
Note that the only thing we can do with these data types is count the number of entries. There are no means or standard deviations, even if your categories are numbered.
You might think it makes sense to calculate the mean of your categories when they are coded as integers [1, 2, 3] and compute that the mean is 2.2. Seems reasonable, but when you instead name your categories as [Small, Medium, Large], does that mean that the average value is Medium-point-2 or Medium-and-a-bit? Sounds a bit silly now, doesn’t it?
Your data are Ordinal or Nominal, which means that multiplication and division are strictly forbidden, so the mean is off the table. You can, though, compute the median (for Ordinal data) or mode (Nominal data), which should tell you the most central or most frequent category.
Summary
Well, I hope that you’re now starting to realise how important it is to know how to identify the data type of every variable in your dataset, and to understand what you can and can’t do with these data types. If you get it right, your analytical choices will all be simple and everything will drop into place. On the other hand, bypassing this step will have serious consequences for your analyses.
The last thing you want to do is take your results to your boss, only for him to tell you that it’s all wrong and you need to start again.
Wasting 6 months is not the worst thing – your boss thinks you’ve no idea what you’re doing.
That is likely to be the difference between getting promoted and not…


