Did you know that there are only 4 types of data in statistics? Do you know what they are (spoiler alert - they are called Nominal, Ordinal, Interval, Ratio) and what you can do with them?
Have you ever looked at your data and wondered how and where to get started? If you don't know the difference between quantitative data and qualitative data then you're in the right place. Here is our guide to statistical data types and how to deal with them...
More...
Disclosure: we may earn an affiliate commission for purchases you make when using the links to products on this page. As an Amazon Affiliate we earn from qualifying purchases.
This post is an introduction to the 4 types of data in statistics. If you're looking to get started with these types of data, then you're in the right place - keep on reading.
This post forms part of a series on the 4 types of data in statistics.
For more detail, choose from the options below:
4 Types of Data in Statistics: Introduction
Data Books For Beginners You'll Love
The 4 Types of Data in Statistics (slideshow)
Ultimately, there are just 2 classes of data in statistics that can be further sub-divided into 4 statistical data types. You may have heard phrases such as 'ordinal data', 'nominal data', 'discrete data' and so on. But have you ever wondered just what they are and what they've got to do with your research and your data?
Surely they are all just fancy words made up by mathematicians and statisticians to make them sound important, aren't they?
Well actually, they are pretty important, because if you know what types of data you have, then you know which maths and stats operations you're allowed to use on your data.
Get that wrong and you're skating on pretty thin ice - sooner or later you're going to make your boss rather unhappy, and nobody wants that, do they?
So take a deep breath and let's go.
I promise this will all be quite painless...
This slideshow will get you a good start on the 4 types of data in statistics, and I'll go into more detail in the following text:
Types of Data in Statistics - Many Names, Lots of Confusion
As you progress through data analysis and statistics, you'll come across lots of different ways to refer to different types of data, and it can get really confusing:
Some of these refer to the same type of data, and some to different.
This blog post will clear up all the confusion - each of these types of data is explained, so when your local, friendly statistician mentions one of them to you in passing, you'll know exactly what she is talking about.
Let's start at the beginning with the highest level of data classification - Quantitative data and Qualitative data.
3 Simple Questions...
What's Stopping You Reaching
YOUR Data Ninja Potential?
Answer 3 questions and we'll recommend the best route to
super-charge your data career
What Are Quantitative and Qualitative Data Types in Statistics?
When it all boils down to it, all data that you collect are either measured or are an observed feature of interest, and at the highest level that gives us 2 kinds of data:
Quantitative data is information about quantities of things, things that we measure, and so we describe them in terms of numbers. As such, quantitative data are also called Numerical data.
On the other hand, qualitative data give us information about the qualities of things. They are observed phenomenon, not measured, and so we generally label them with names. Qualitative data are also known as Categorical data.
2 Types of Quantitative Data - Discrete Data and Continuous Data
There are 2 types of quantitative data – Discrete data and Continuous data.
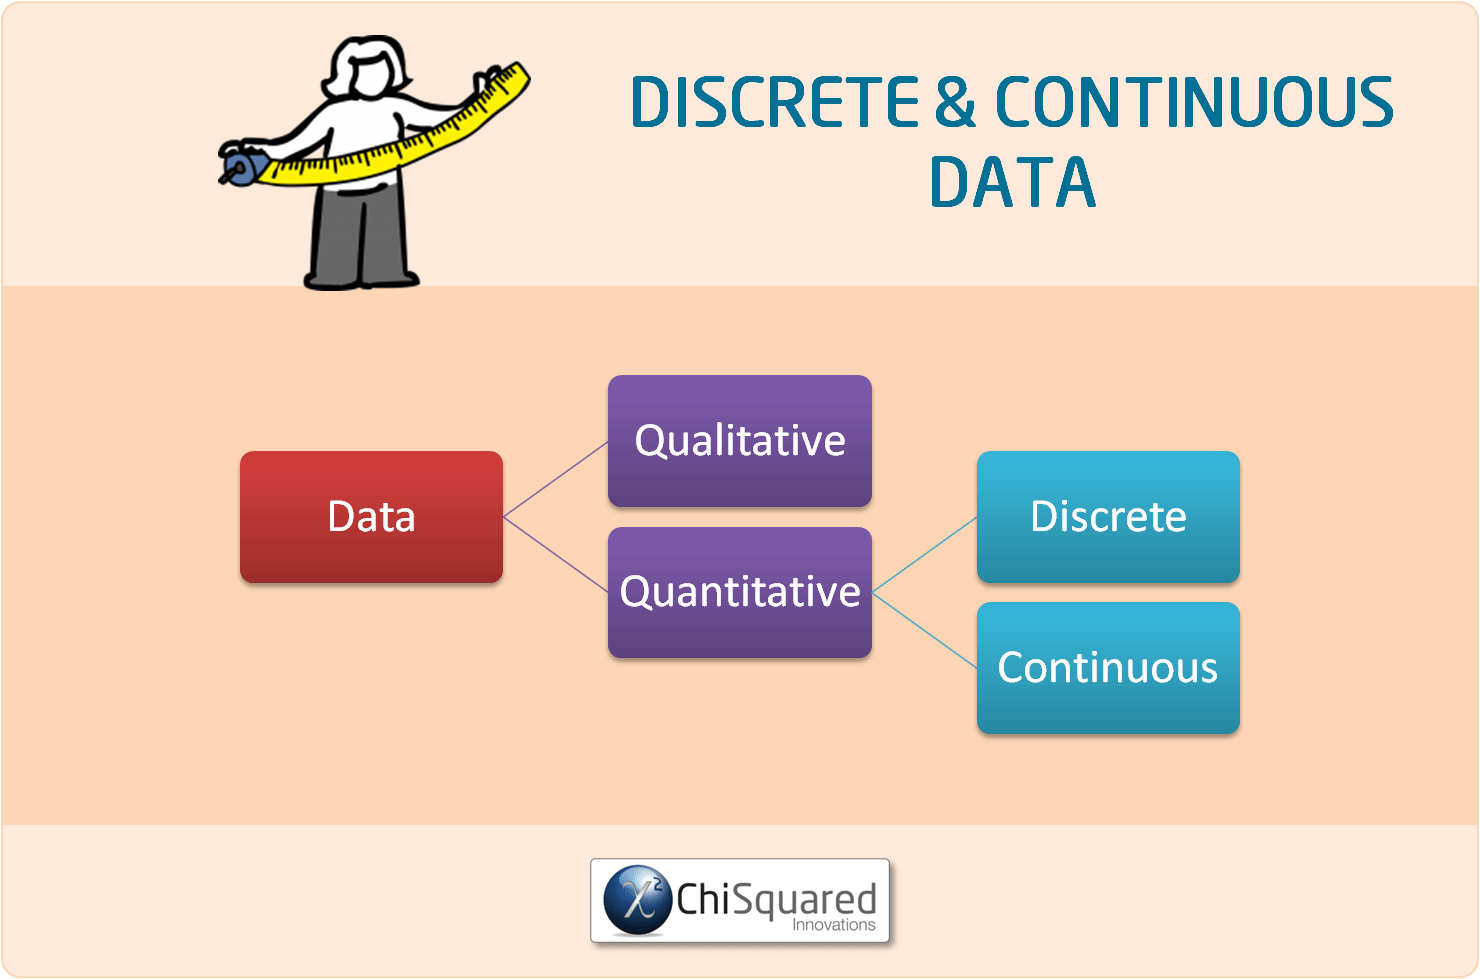
Discrete data is information that can only take certain values and can't be made more precise. This might only be whole numbers, like the numbers on a die (any number from 1 to 6) or could be other types of fixed number scheme, such as shoe sizes (2, 2.5, 3, 3.5, etc.). They are called discrete data because they have fixed points and measures inbetween do not exist (you can't get 2.5 on a die, nor can you have a shoe size of 3.49).
Counted data are also discrete data, so numbers of students in a class, number of patients in the hospital and number of marbles in a bag are all examples of discrete data.
On the other hand, continuous data is data that can take any value, usually within certain limits, and could be divided into finer and finer parts. A person's height is continuous data as it can be measured in metres and fractions of metres (centimetres, millimetres, nanometres). Time of an event is also continuous data and can be measures in years and divided into smaller fractions, depending on how accurately you wish to record it (months, days, hours, minutes, seconds, etc.).
Pin it for later
Need to save this for later?
Pin it to your favourite board and you can get back to it when you're ready.
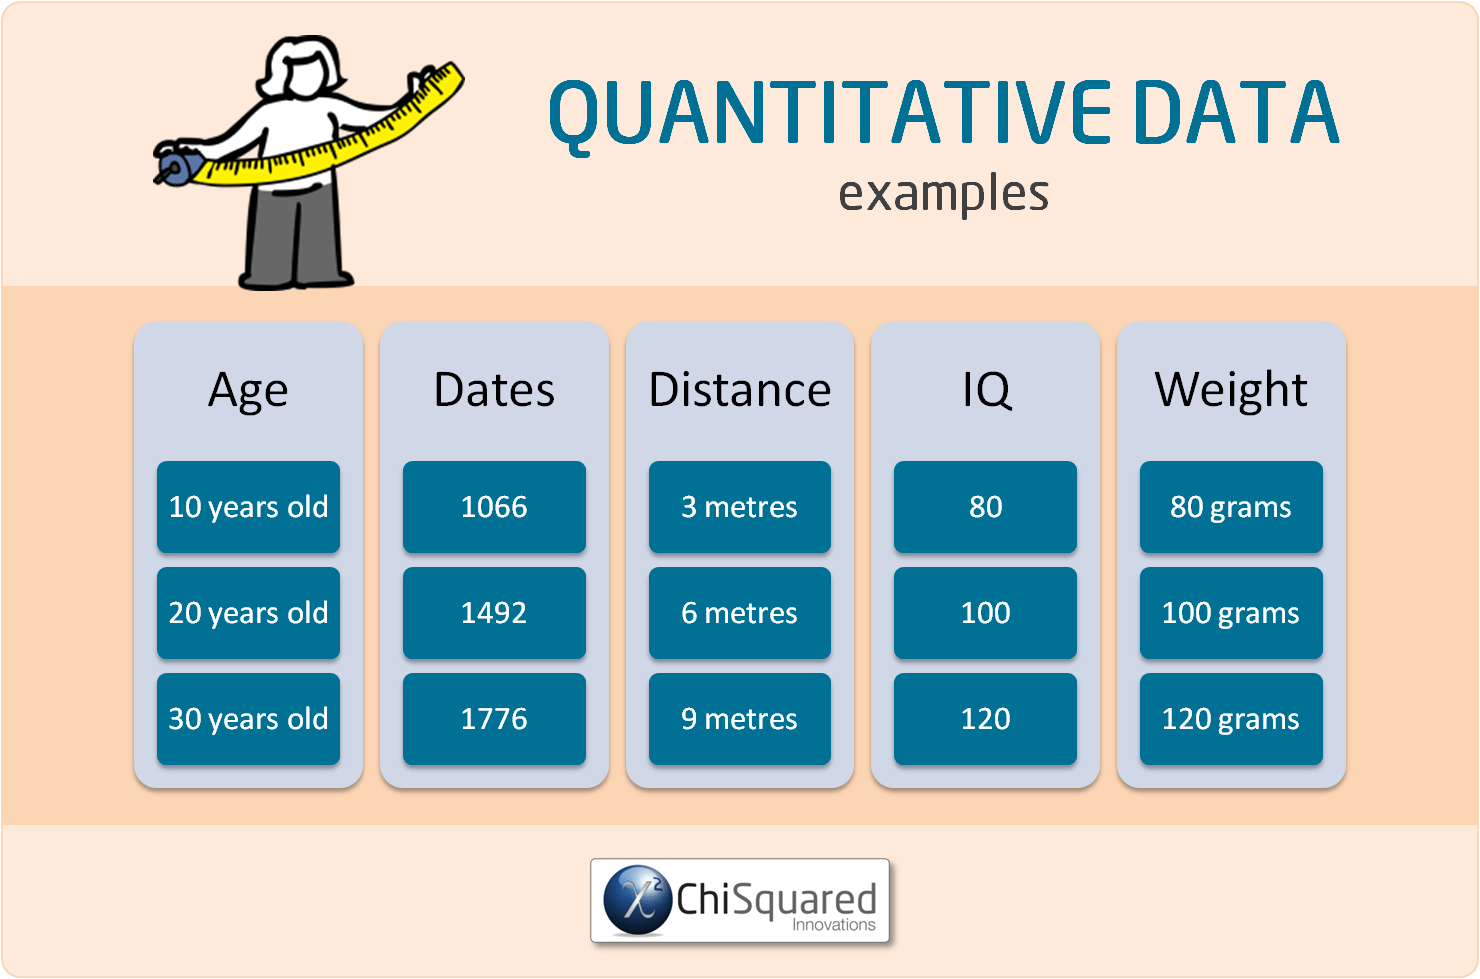
What Are Examples of Quantitative Data?
Quantitative data are measured with some kind of measuring implement - ruler, jug, weighing scales, stop-watch, thermometer and so on.
Here are some examples of quantitative data that can be measured with a ruler or measuring tape:
Examples of quantitative data that you can measure with a jug include:
Other things that are examples of quantitative data are:
What Are Examples of Qualititive Data?
Qualitative data are observed data that are placed into categories. This could be anything from the colour of eyes, country of origin, animal species, to emotional state, level of opinion, political views and religious beliefs.
Here are some examples of qualitative data:

How Can You Tell if Data are Quantitative or Qualitative?
What is the difference between quantitative data and qualitative data? Simply put:
In practical terms, when data are text-based, such as Types of Animals [Pig, Sheep, Cow], then they are qualitative data. When they are number-based, like Length (2.13 metres or 5.72 miles) they are quantitative data.
The one exception to this is when categories have been numbered for practical purposes, such as Types of Animals [1, 2, 3] instead of [Pig, Sheep, Cow]. In this case, the numbers must be treated as the names of the categories - you're not allowed to do any calculations with them!
More on that later...




Tools for measuring quantitative data


Qualitative data are categorised
What Are the 4 Types of Data in Statistics?
Back in 1946, the American psychologist Stanley Smith Stevens published a famous paper in the journal Science titled 'On the theory of scales and measurement'.
In this paper he claimed that all measurement in science was conducted using 4 different types of scales that he called:
This paper essentially unified Qualitative data (Nominal data and Ordinal data) and Quantitative data (Interval data and Ratio data).
Quantitative data and Qualitative data can be sub-divided into 4 further classes of statistical data types; Ratio, Interval, Ordinal and Nominal Data, like this:
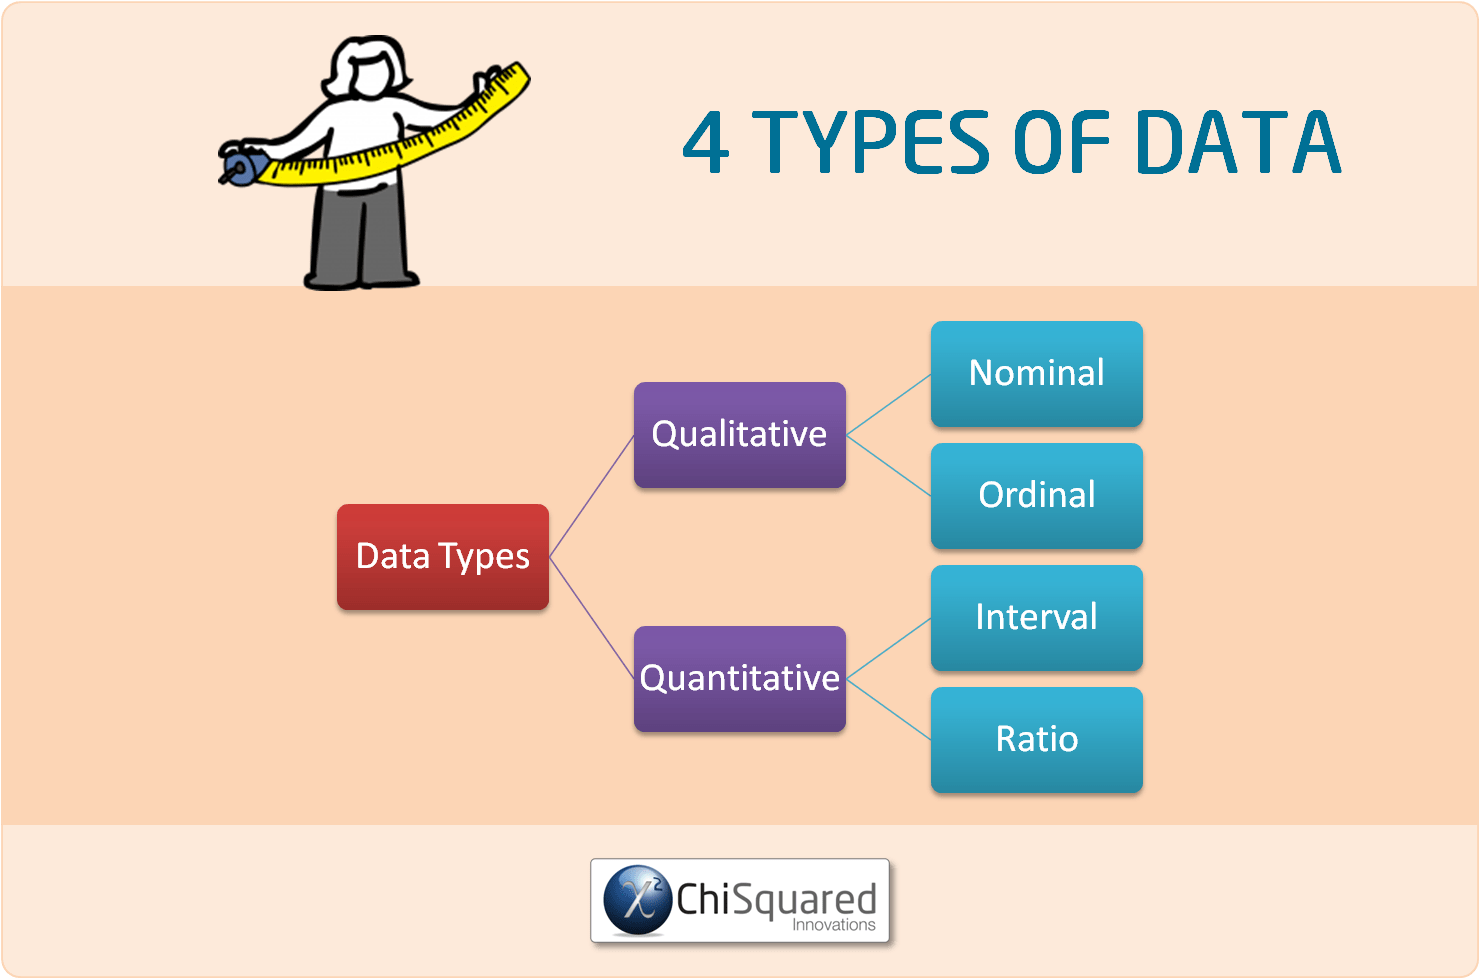
You can figure the difference by asking just 2 questions:
We'll delve into this deeper soon, but for now it's useful for you to remember that if you can answer just these 2 questions then you can correctly determine each of your 4 types of statistical data.
4 Types of Data in Statistics: "you can distinguish between all types of data by asking just 2 simple questions" @chi2innovations #dataanalytics #datatypes #statistics
And if you’re wondering about the relationship between Discrete Data and Continuous Data, and each of Ratio and Interval data, either of Discrete data and Continuous data can be Ratio data or Interval data.
If you have identified that your variable is Discrete data, then remind yourself of the questions above and ask yourself whether your data have a true zero. If they do, they are Ratio data, and if not, they are Interval data.
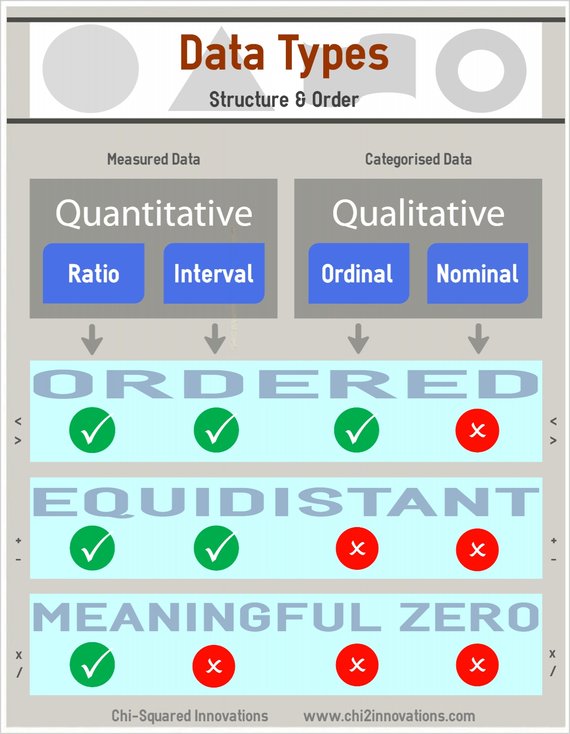
The following infographic might help you to understand the 4 types of data in statistics and to visualise what we’re discussing. We’ll refer to it throughout...


What Type of Data is Nominal Data?
Nominal data is the statistical data type that has the following characteristics:
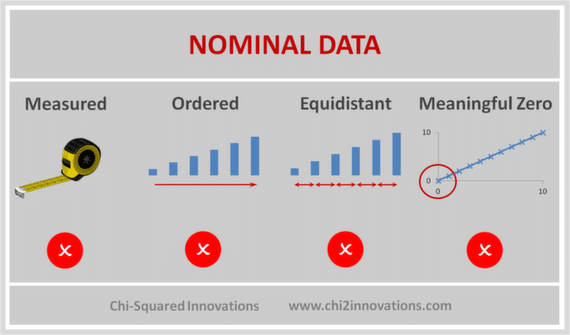


Nominal Data are observed, not measured, are unordered, non-equidistant and have no meaningful zero
We can differentiate between categories based only on their names, hence the title 'nominal' (from the Latin nomen, meaning 'name').
What are Examples of Nominal Data?
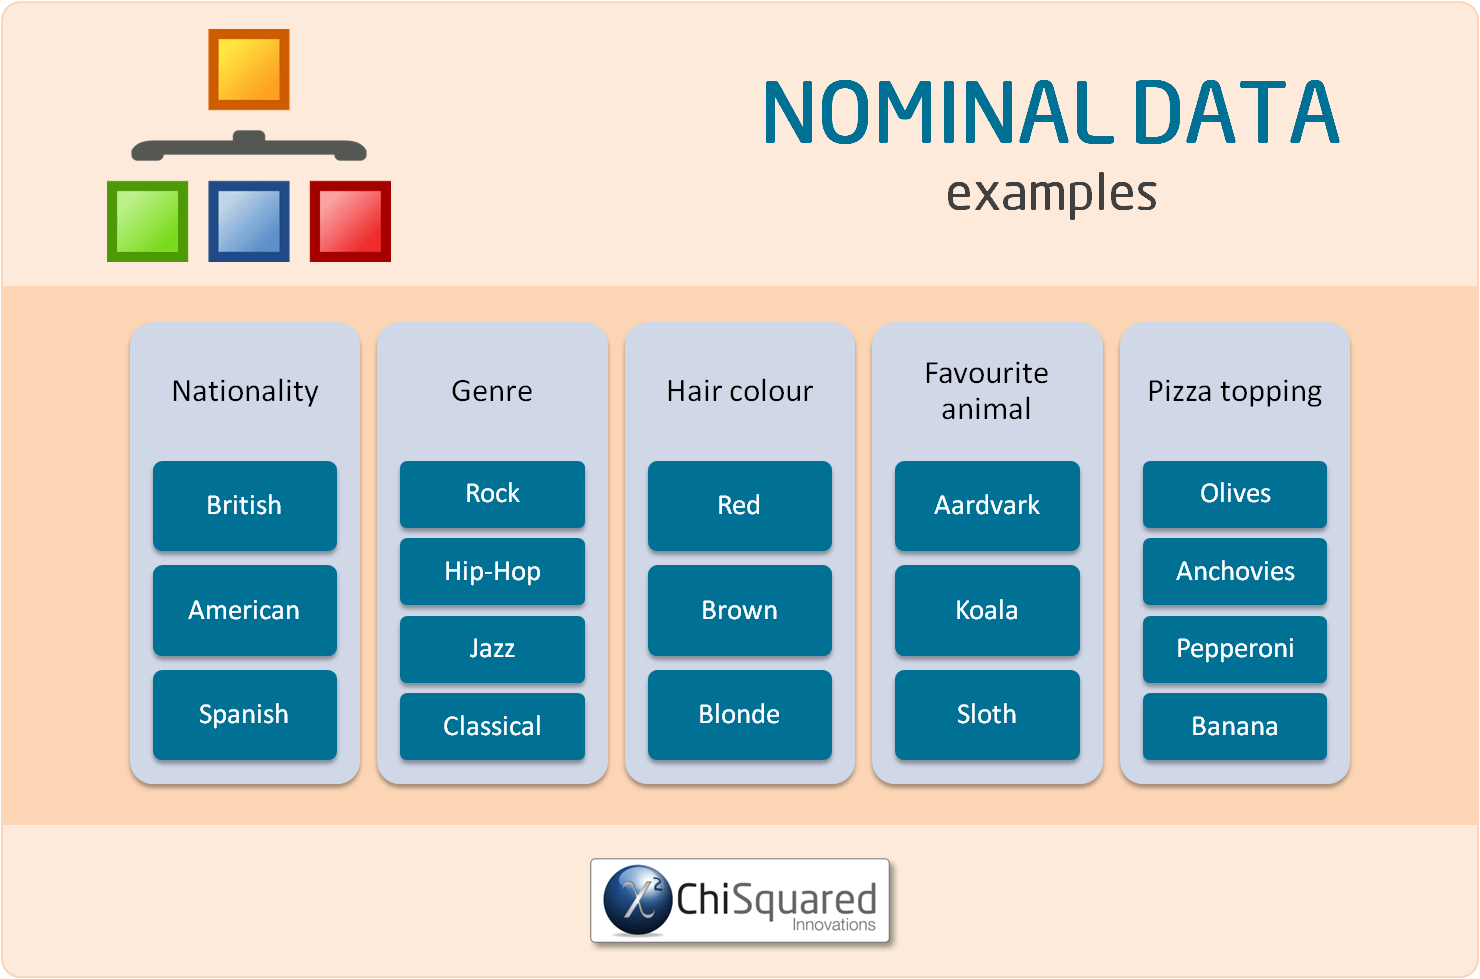
Examples of Nominal data include:
You can see that in each of these examples of Nominal data the categories have no order.
What Can You Calculate With Nominal Data?
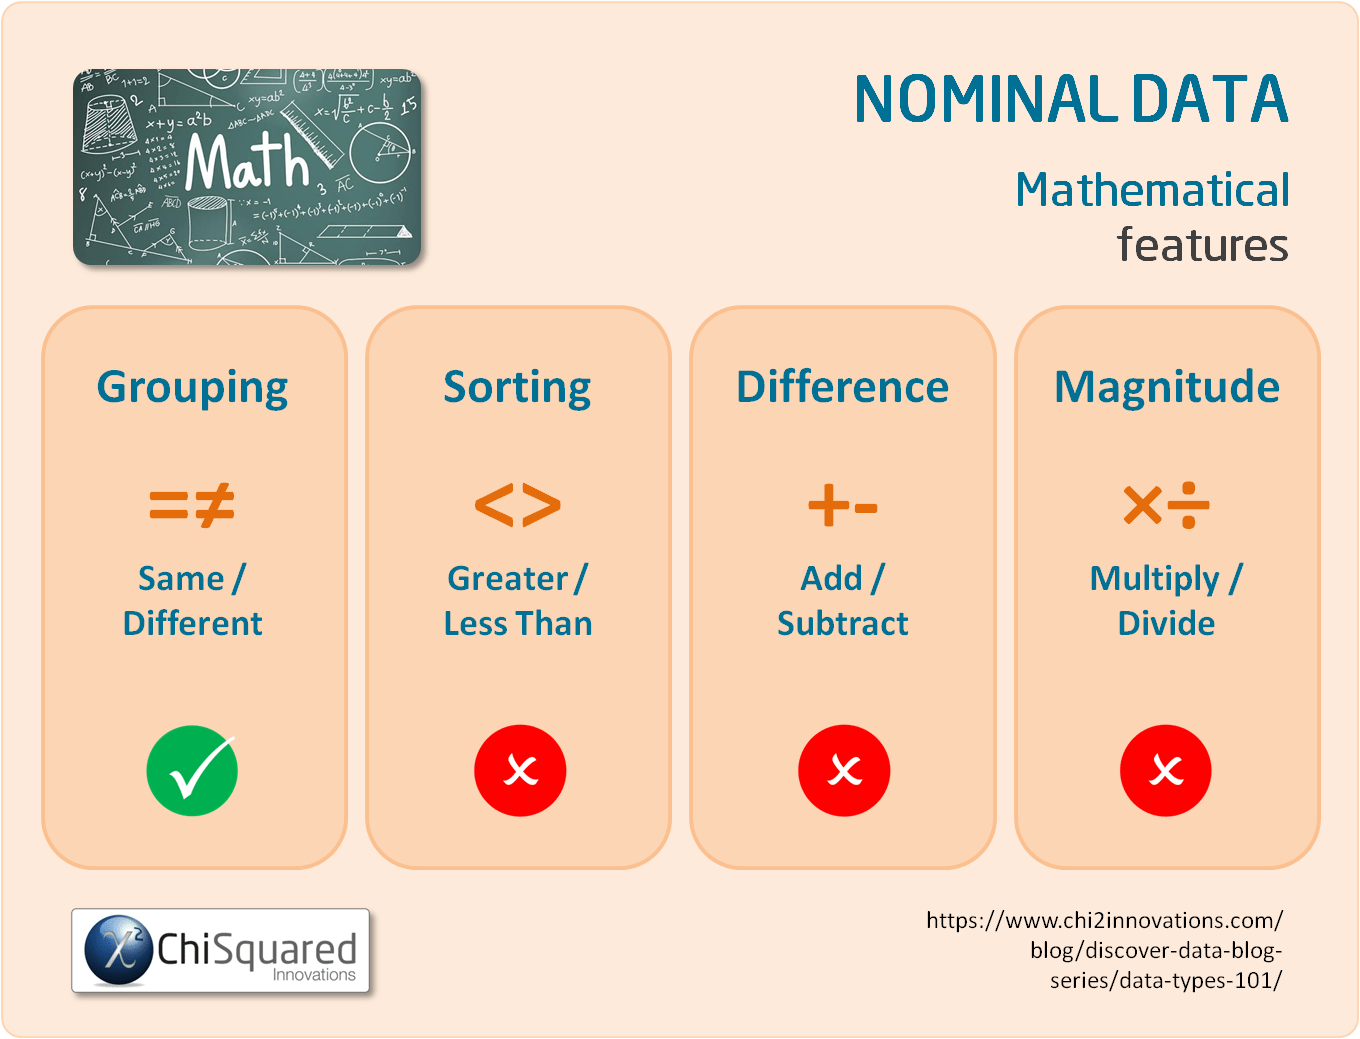
The only mathematical or logical operations you can perform on Nominal data is to say that an observation is (or is not) the same as another (equality or inequality), and you can use this information to group them together.
You can't order Nominal data, so you can't sort them. Neither can you do any mathematical operations because they are reserved for numerical data.
What Descriptive Statistics Can You Do With Nominal Data?
With Nominal data you can calculate the following:
Other ways of finding the middle of the class, such as median or mean make no sense because ranking is meaningless for nominal data.
What Else Can You Do With Nominal Data?
If you need to know more about Nominal data and what you can do with them, including descriptive statistics, data visualisations, creating dummy variables and which statistical tests you can use with them, you can find out more in our in-depth post about Nominal data.
Types of Data in Statistics
FREE Booklet
Download your FREE Booklet and learn how to deal with Statistical Data Types - all of them!
What Type of Data is Ordinal Data?
Ordinal data is the statistical data type that has the following characteristics:
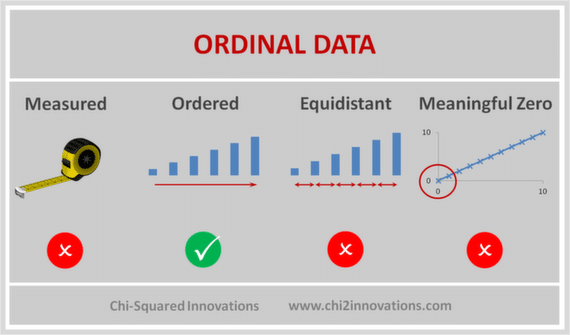


Ordinal Data are observed, not measured, are ordered but non-equidistant and have no meaningful zero
Their categories can be ordered (1st, 2nd, 3rd, etc. - hence the name 'ordinal'), but there is no consistency in the relative distances between adjacent categories.
What are Examples of Ordinal Data?
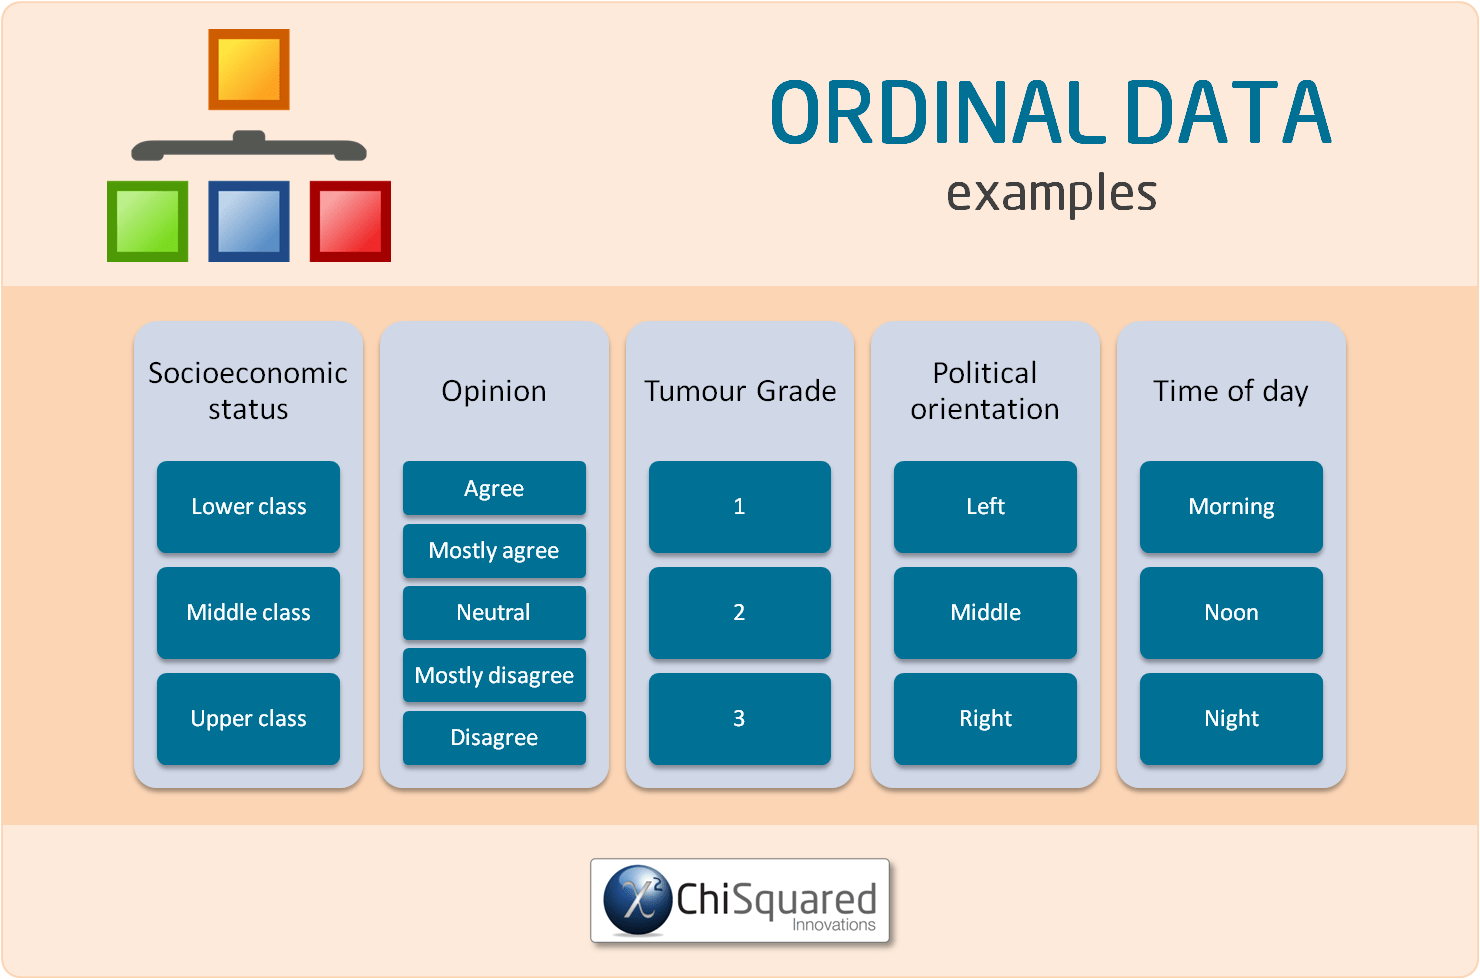
Examples of Ordinal data include:
In the examples of Ordinal data above, there is an obvious order to the categories.
What Can You Calculate With Ordinal Data?
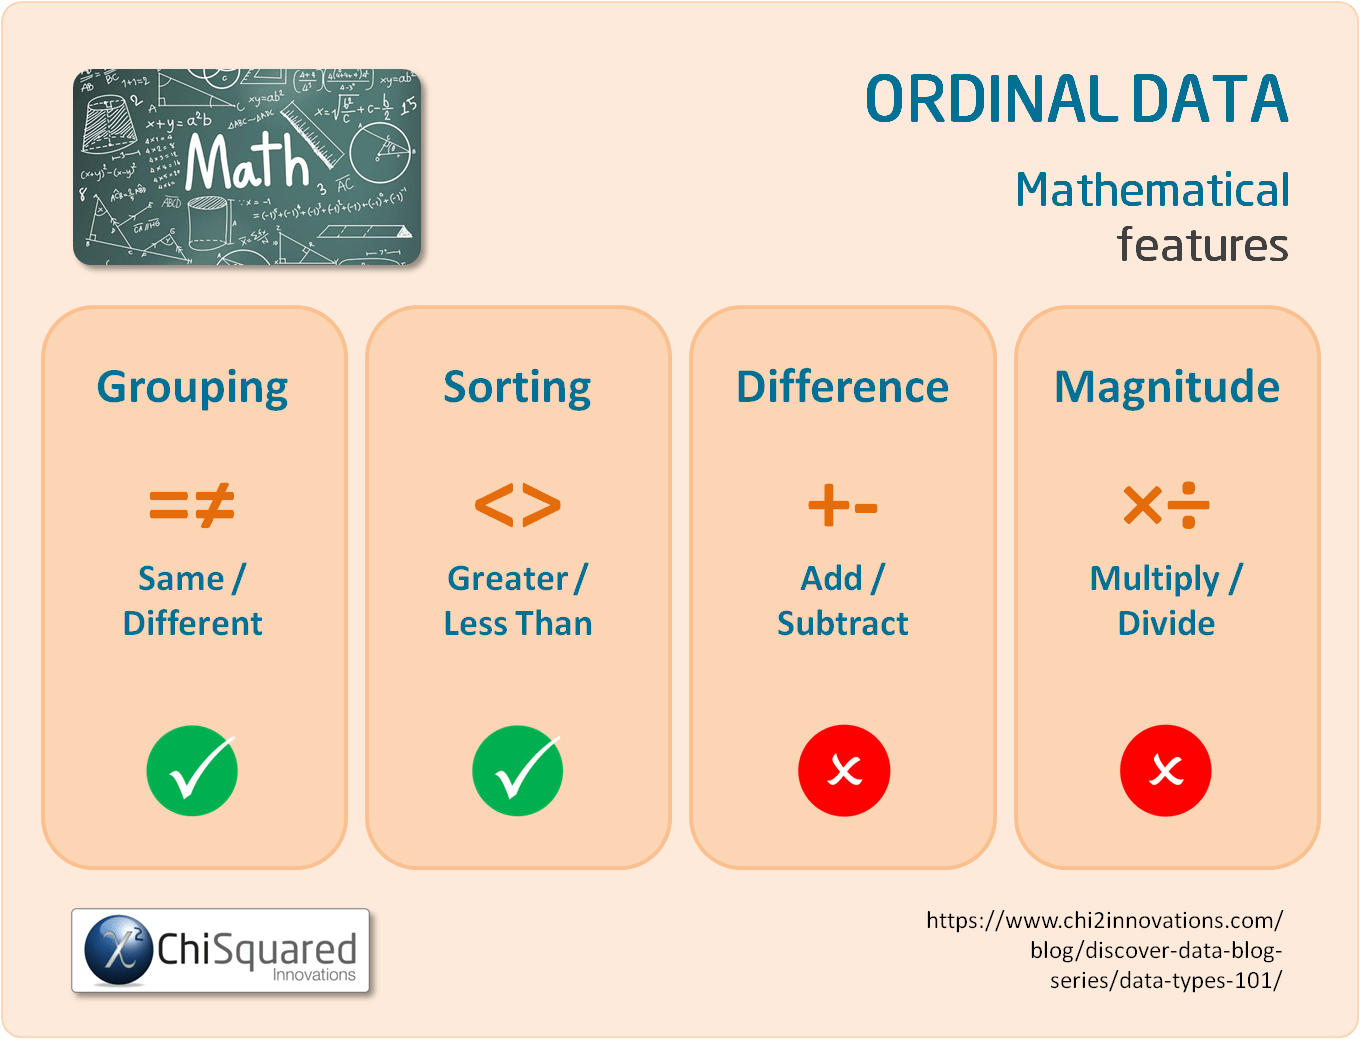
With Ordinal data, as with Nominal data, you can group the data by assessing whether they are the same or different.
As Ordinal data are ordered, they can be sorted by making simple comparisons between the categories, such as Greater/Less than, More/Less, Higher/Lower, etc..
You can't do any mathematical operations with Ordinal data, though, because they aren't numerical data.
What Descriptive Statistics Can You Do With Ordinal Data?
With Ordinal data you can calculate precisely the same things as you can with Nominal data, with a couple of extra things (see if you can spot them). That is:
What Else Can You Do With Ordinal Data?
If you need to know more about Ordinal data and what you can do with them, including descriptive statistics, data visualisations, creating dummy variables and which statistical tests you can use with them, you can find out more in our in-depth post about Ordinal data.
What is the Difference Between Ordinal Data and Nominal Data?
Ordinal data and Nominal data are both qualitative data, and the difference between them is that Nominal data can only be classified - arranged into classes or categories - whereas Ordinal data can be classified and ordered.
One of the assumptions of Ordinal data is that although the categories are ordered, they do not have equal intervals.
What Type of Data is Interval Data?
Interval data is the data type in statistics that has the following characteristics:
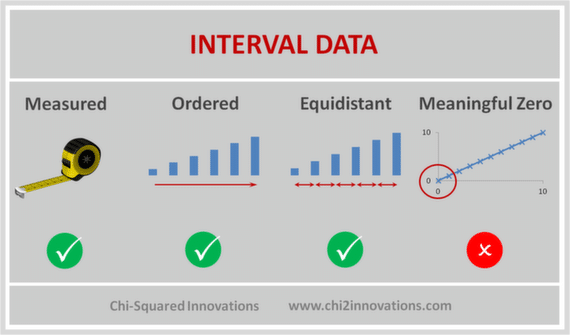


Interval Data are measured and ordered with equidistant items, but have no meaningful zero
Interval data are ordered, can be continuous (have an infinite number of steps) or discrete (organised into categories), and the degree of difference between items is meaningful (their intervals are equal), but not their ratio.
The key points of an Interval scale is that the word 'interval' means 'space inbetween', which is the important thing to remember - interval scales not only tell us about order, but also about the value between each item.
What are Examples of Interval Data?
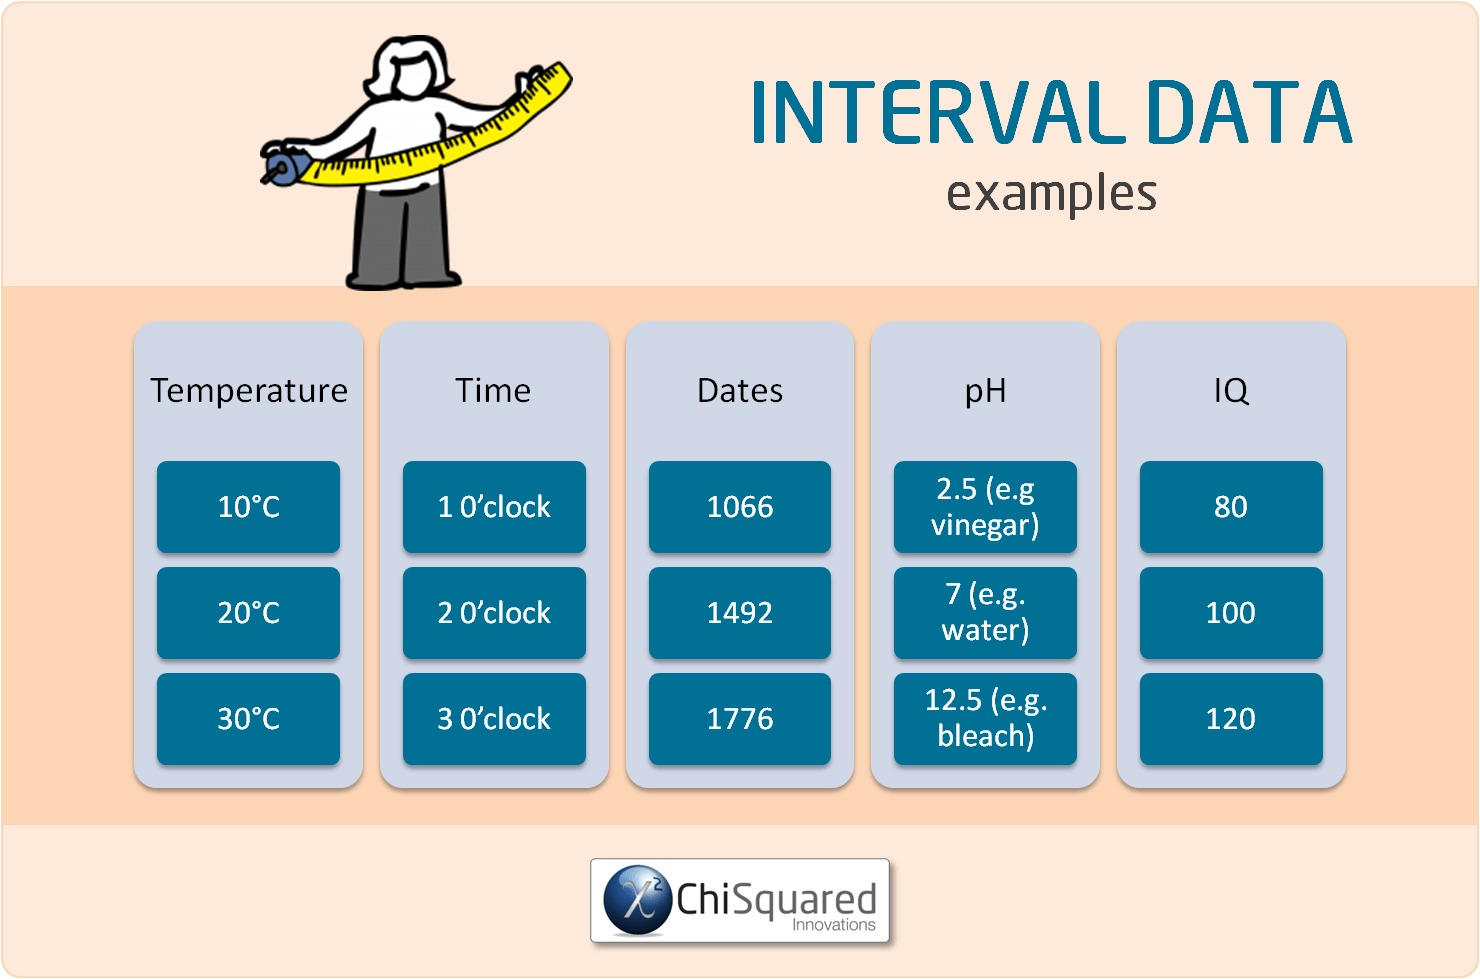
Examples of Interval data include:
Crucially, Interval data can be negative, whereas Ratio data cannot.
Although Interval data can appear very similar to ratio data, the difference is in their defined zero-points. If the zero-point of the scale has been chosen arbitrarily (such as the melting point of water or from an arbitrary epoch such as AD) then the data cannot be Ratio data and must be Interval data.
What Can You Calculate With Interval Data?
With Interval data you can compare the degrees of the data (equality/inequality, more/less) and you can also add/subtract the values.
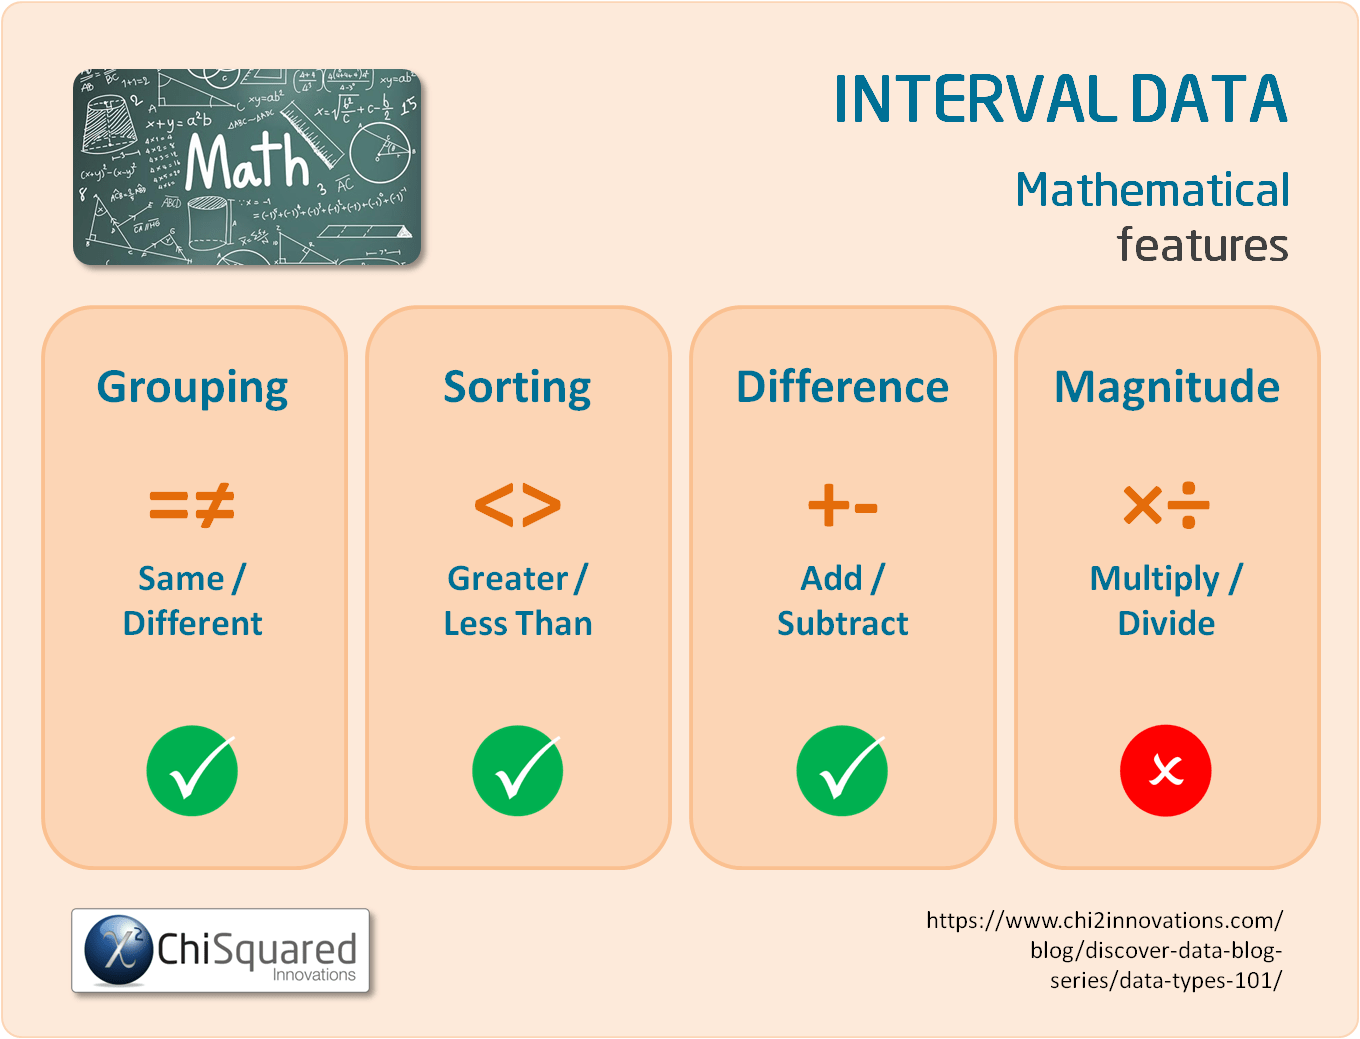
For example, with Interval data you can say things such as '28°C is 8 degrees hotter than 20°C' (28 - 8 = 20) or '6pm is 4 hours later than 2pm' (2 + 4 = 6).
However, you cannot multiply or divide the numbers because of the arbitrary zero, so you can't say 'a person with an IQ of 150 is 3 times as smart as a person with an IQ of 50' or '6pm is twice as late as 3pm'.
What Descriptive Statistics Can You Do With Interval Data?
As Interval data are quantitative data (continuous data), the descriptive statistics for these are very different to those for qualitative data.
The central value of Interval data is typically the mean (but could be the median or mode). You can also express the spread or variability of the data using measures such as the range, standard deviation, variance and/or confidence intervals.
In summary, the descriptive statistics you can calculate for Interval data are:
What Else Can You Do With Interval Data?
If you need to know more about Interval data and what you can do with them, including descriptive statistics, data visualisations, creating dummy variables and which statistical tests you can use with them, you can find out more in our in-depth post about Interval data.
What Type of Data is Ratio Data?
Ratio data is the data type in statistics that has the following characteristics:
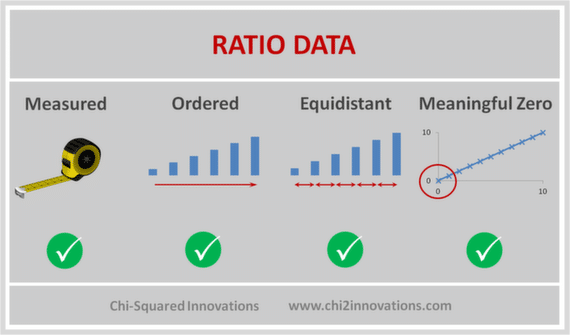


Ratio Data are measured and ordered with equidistant items and a meaningful zero
As with Interval data, Ratio data can be continuous or discrete, and differs from Interval data in that there is a non-arbitrary zero-point to the data. In other words, Interval data can take negative values, whereas Ratio data cannot be negative.
What are Examples of Ratio Data?
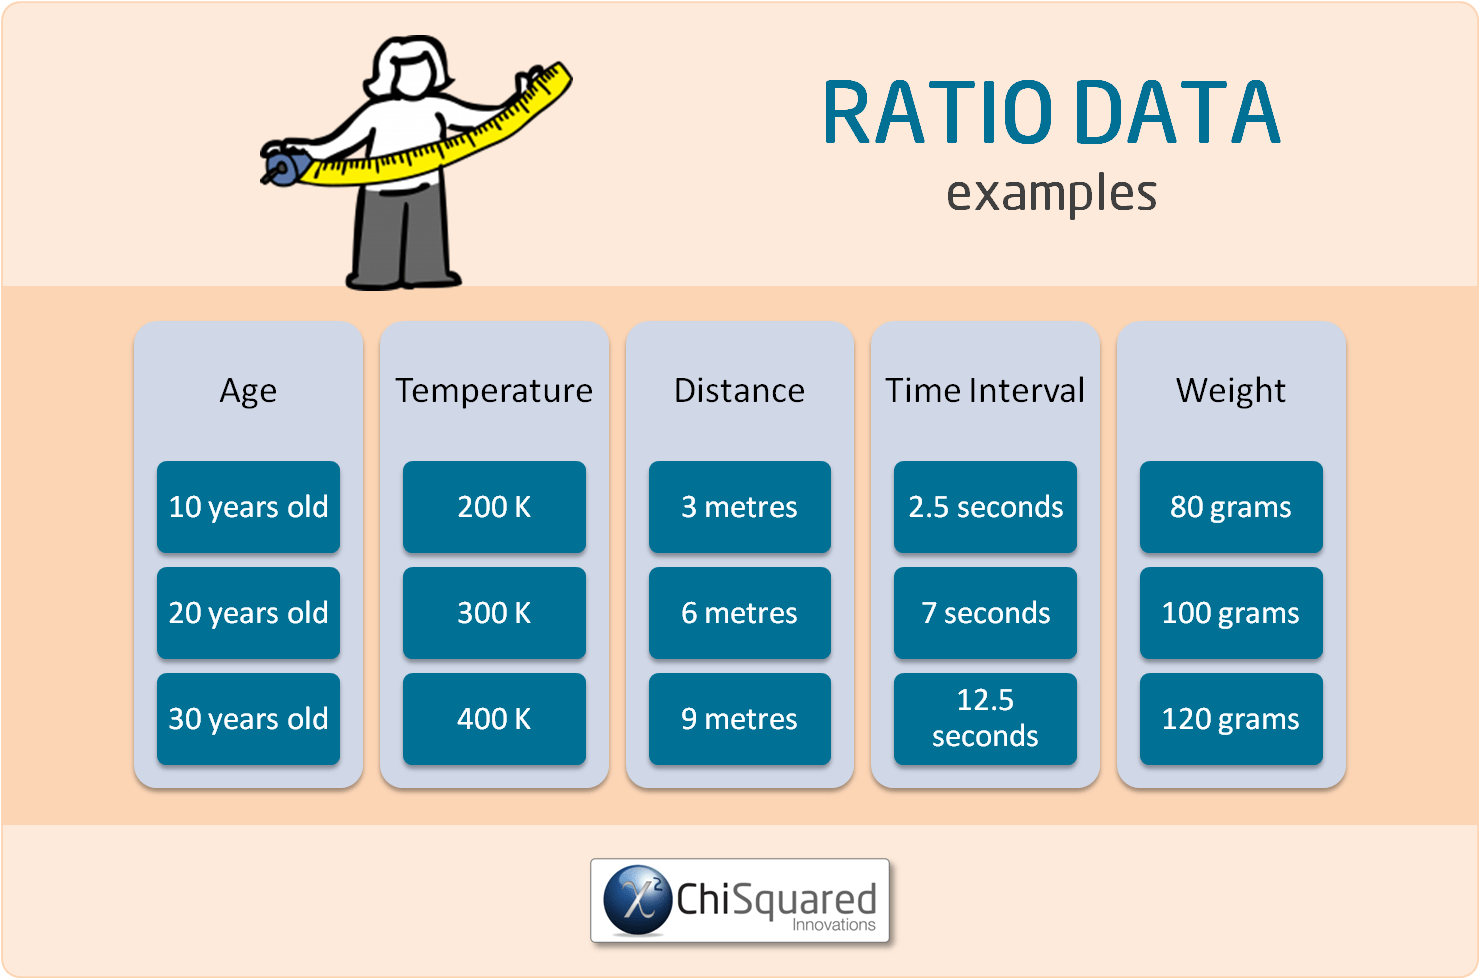
Examples of Ratio data include:
For each of these examples of Ratio data there is a real, meaningful zero-point. The age of a person, absolute zero, distance measured from a pre-determined point or time all have real zeros.
With real zero-points we can multiply and divide the numbers - a 6 year old is half the age of a 12 year old and matter at 100K has half the energy of matter at 200K. Similarly, the distance from Barcelona to Berlin is half the distance as Barcelona to Moscow, and it takes me twice as long to run the 100m as Usain Bolt but only half the time of my Grandad.
In the examples of Ratio data above, can you see why Temperature measured in °C or F are examples of Interval data, whereas Temperature measured in Kelvins is an example of Ratio data? [Hint: zero Kelvins is also known as Absolute Zero]
What Can You Calculate With Ratio Data?
With Ratio data, all cards are on the table. You can compare the data (equal or not), you can sort the values (greater/less than), add/subtract them, and you can also multiply or divide them.
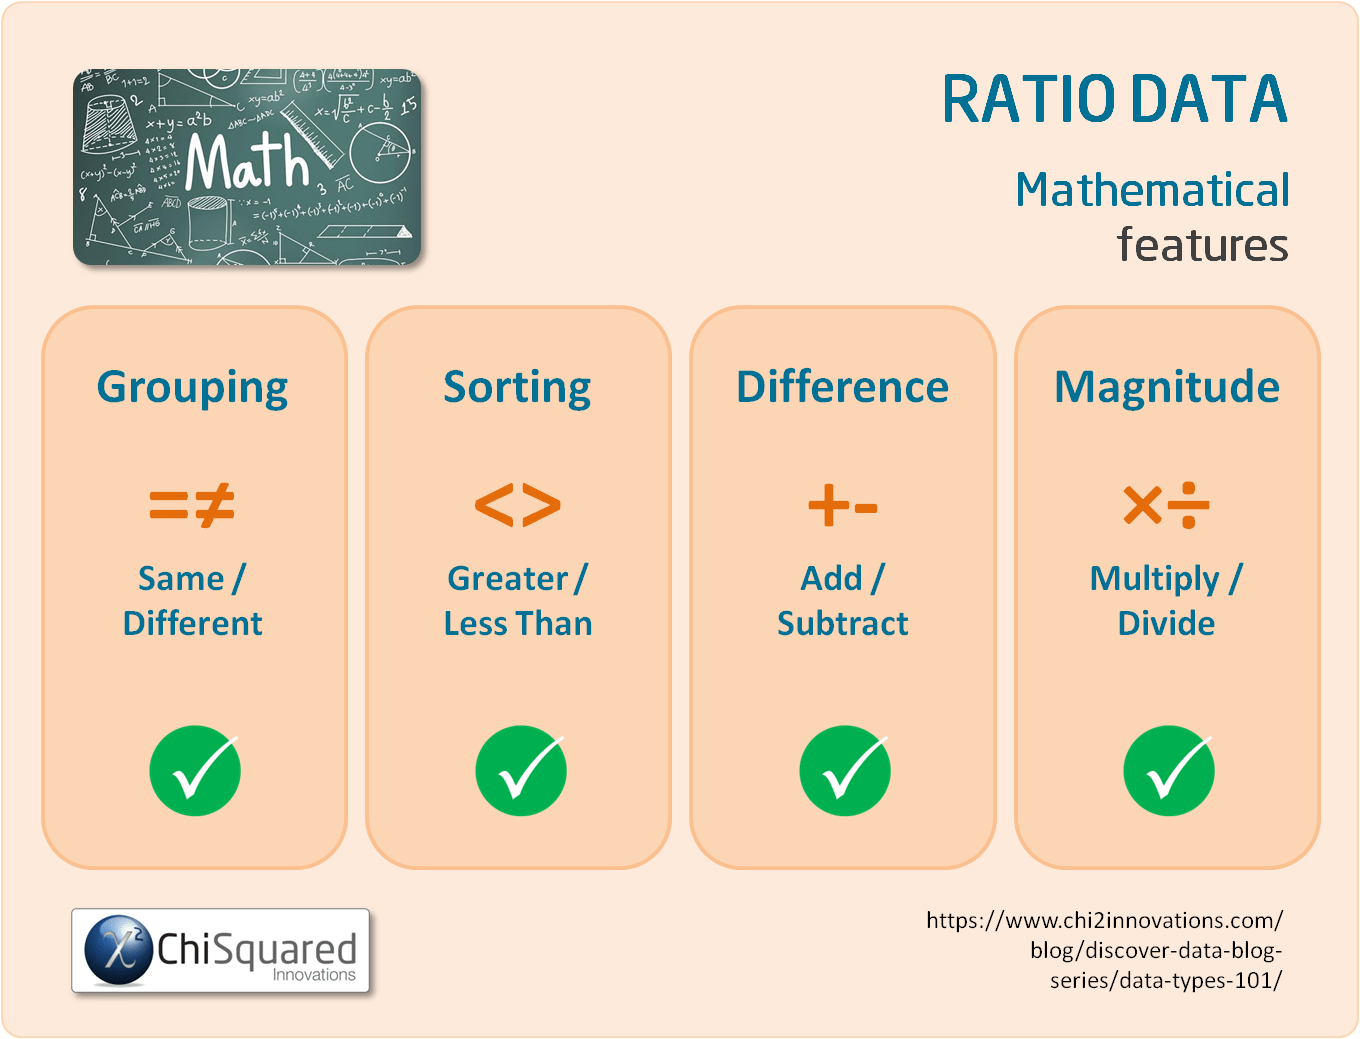
For example, with Ratio data you can check whether your apples weigh the same, you can sort them from heaviest to lightest and you can calculate the differences in their weights.
With Ratio data you can also multiply and divide your numerical data, so you can calculate the ratios of their weights and say things like 'this 100 gram apple weighs twice as much as this 50 gram apple'.
What Descriptive Statistics Can You Do With Ratio Data?
With Ratio data you can calculate precisely the same things as you can with Interval data. That is:
What Else Can You Do With Ratio Data?
If you need to know more about Ratio data and what you can do with them, including descriptive statistics, data visualisations, creating dummy variables and which statistical tests you can use with them, you can find out more in our in-depth post about Ratio data.
What is the Difference Between Ratio Data and Interval Data?
Both Ratio data and Interval data are quantitative data (numerical data).
The only difference between them is that while both Ratio data and Interval data have equal spacing between adjacent values (so you can add and subtract their values), only Ratio data have a true zero.
That is, Interval data can take negative values, whereas Ratio data cannot - and this means that Ratio data can be multiplied and divided, but Interval data cannot.

UNIQUE VIDEO COURSE
In less than 2 hours
your data can be:
Statistical Data Types: Summary
Hopefully, by now you have a good understanding of what Ratio, Interval, Ordinal and Nominal data are, and what you can do with them.
Nominal Data are observed, not measured. They are unordered, non-equidistant and have no meaningful zero. Their categories are named, and you can group together data points that are the same and separate those that are different.
Ordinal Data are also observed, not measured. They are ordered but non-equidistant and have no meaningful zero. Categories are named, and once data are grouped you can sort them.
Nominal data and Ordinal data are types of Qualitative data (also known as categorical data), and you cannot perform any mathematical operations on Nominal data, nor on Ordinal data.
Interval Data are measured and ordered with equidistant items, but have no meaningful zero. You can sort Interval data and you can add and subtract their values.
Ratio Data are also measured and ordered with equidistant items and a meaningful zero. Ratio data can be sorted, added and subtracted, but can also be multiplied and divided.
Interval data and Ratio data are types of Quantitative data (also known as numerical data).
The basics of statistics, like data collection, data cleaning and data integrity aren't sexy, and as a result are often neglected, and that is also the case with data types.
In my experience, few people that have to do statistics as part of their research know and understand the statistical data types, and as a result struggle to get to grips with what they can and can't do with their data.
That's a shame, because as you've seen, if you know the 4 types of data in statistics you know:
In short, data types are a roadmap to doing your entire study properly.
They really are that important!
Now that you've got a good start with quantitative data and qualitative data, you might also like to read this post's sister articles on Nominal data, Ordinal data, Interval data and Ratio data.
In the final posts we'll compare each of the 4 types of data and I'll also show you how to choose the correct statistical hypothesis test.
Do you have any questions about any of these types of data? Is there something that I've missed out?
Let me know in the comments below - your feedback will help me to improve the post and make learning about data and statistics easier for everybody!
This post forms part of a series on the 4 types of data in statistics.
For more detail, choose from the options below:


