Ordinal data is one of only 4 types of data in statistics.
Do you know what they all are and what you can do with them?
If you want to know everything there is to know about Ordinal data - definitions, examples, analysis and statistics - then you're in the right place.
When you're done here, you'll also want to read this post's sister articles on quantitative data and qualitative data, Nominal data, Interval data and Ratio data.
For now, though, here is our guide to Ordinal data and how to deal with them...
More...
Disclosure: we may earn an affiliate commission for purchases you make when using the links to products on this page. As an Amazon Affiliate we earn from qualifying purchases.
This post forms part of a series on the 4 types of data in statistics.
For more detail, choose from the options below:
4 Types of Data in Statistics: Introduction
What is Ordinal Data?
If you want a simple definition of Nominal data, it would be this:
Ordinal Data Definition
Ordinal data is a type of categorical data in which the values follow a natural order
Ordinal data is the statistical data type that has the following characteristics:
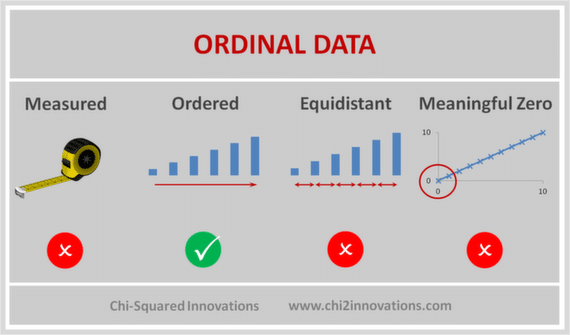
Ordinal Data are observed, not measured, are ordered but non-equidistant and have no meaningful zero
Their categories can be ordered (1st, 2nd, 3rd, etc. - hence the name 'ordinal'), but there is no consistency in the relative distances between adjacent categories.
As with Nominal data, Ordinal data can have 2 categories, and we also call these dichotomous data. The only difference between Nominal dichotomous data and Ordinal dichotomous data is that Ordinal dichotomous data have an order, whereas Nominal dichotomous data do not.

Pin it for later
Need to save this for later?
Pin it to your favourite board and you can get back to it when you're ready.
Ordinal Data Examples
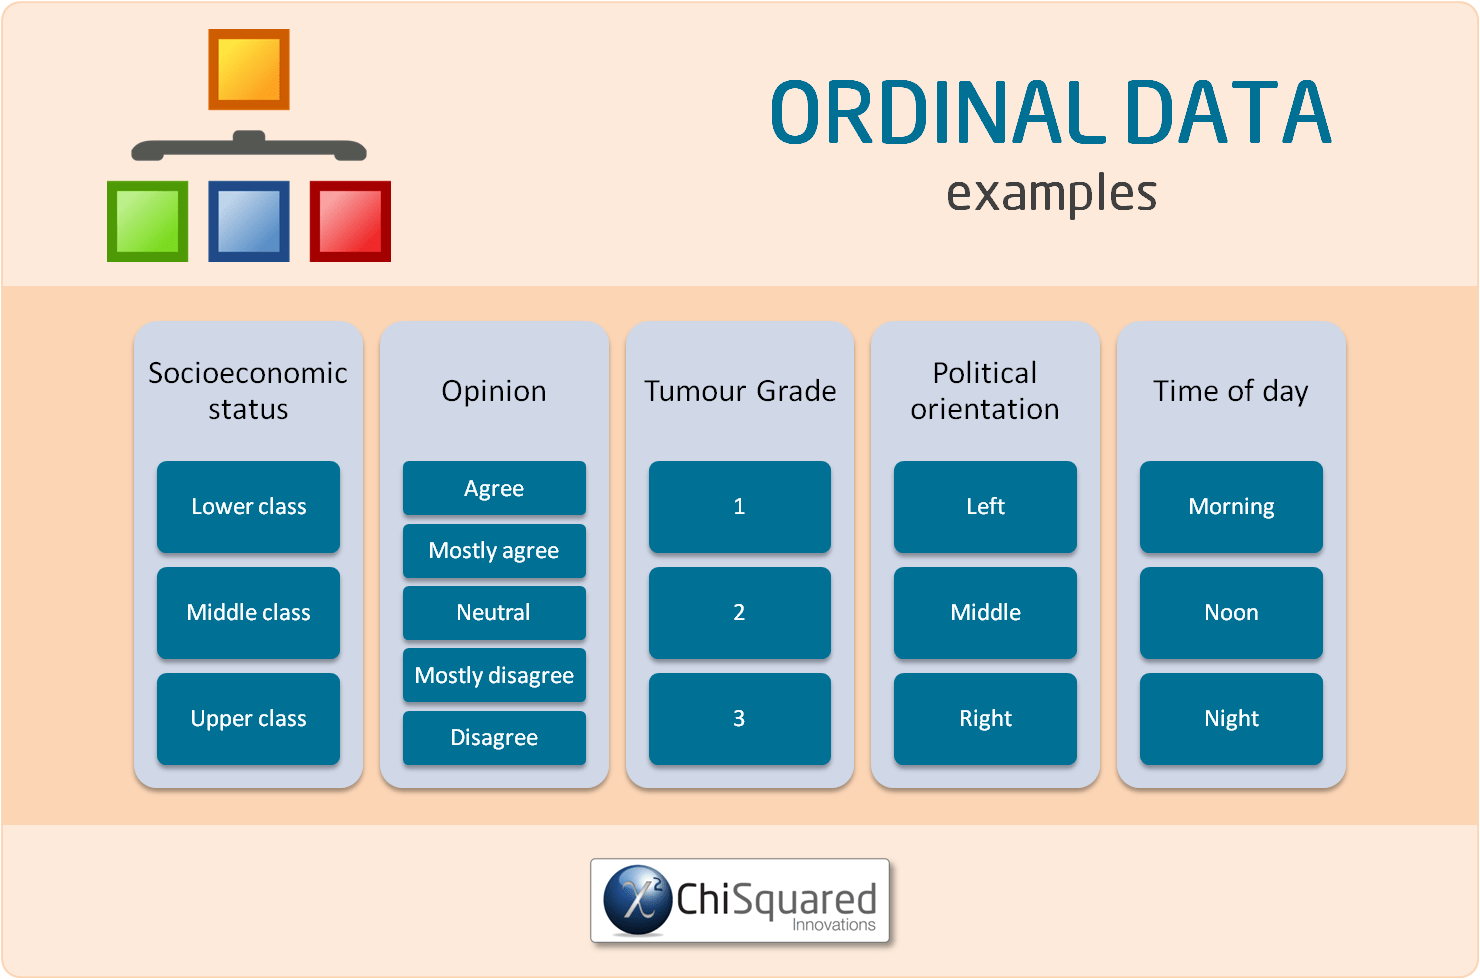
Examples of Ordinal data include:
In the examples of Ordinal data above, there is an obvious order to the categories. Are any of the examples of Ordinal data above examples of dichotomous data?
What Can You Calculate With Ordinal Variables?
When Ordinal data are used in analysis, they are called Ordinal Variables, so that's what we'll call them from here.
With Ordinal variables you can group the data by assessing whether they are the same or different.
As Ordinal variables are ordered, they can be sorted by making simple comparisons between the categories, such as Greater/Less than, More/Less, Higher/Lower, etc..
You can't do any mathematical operations with Ordinal variables, though, because they aren't numerical data.
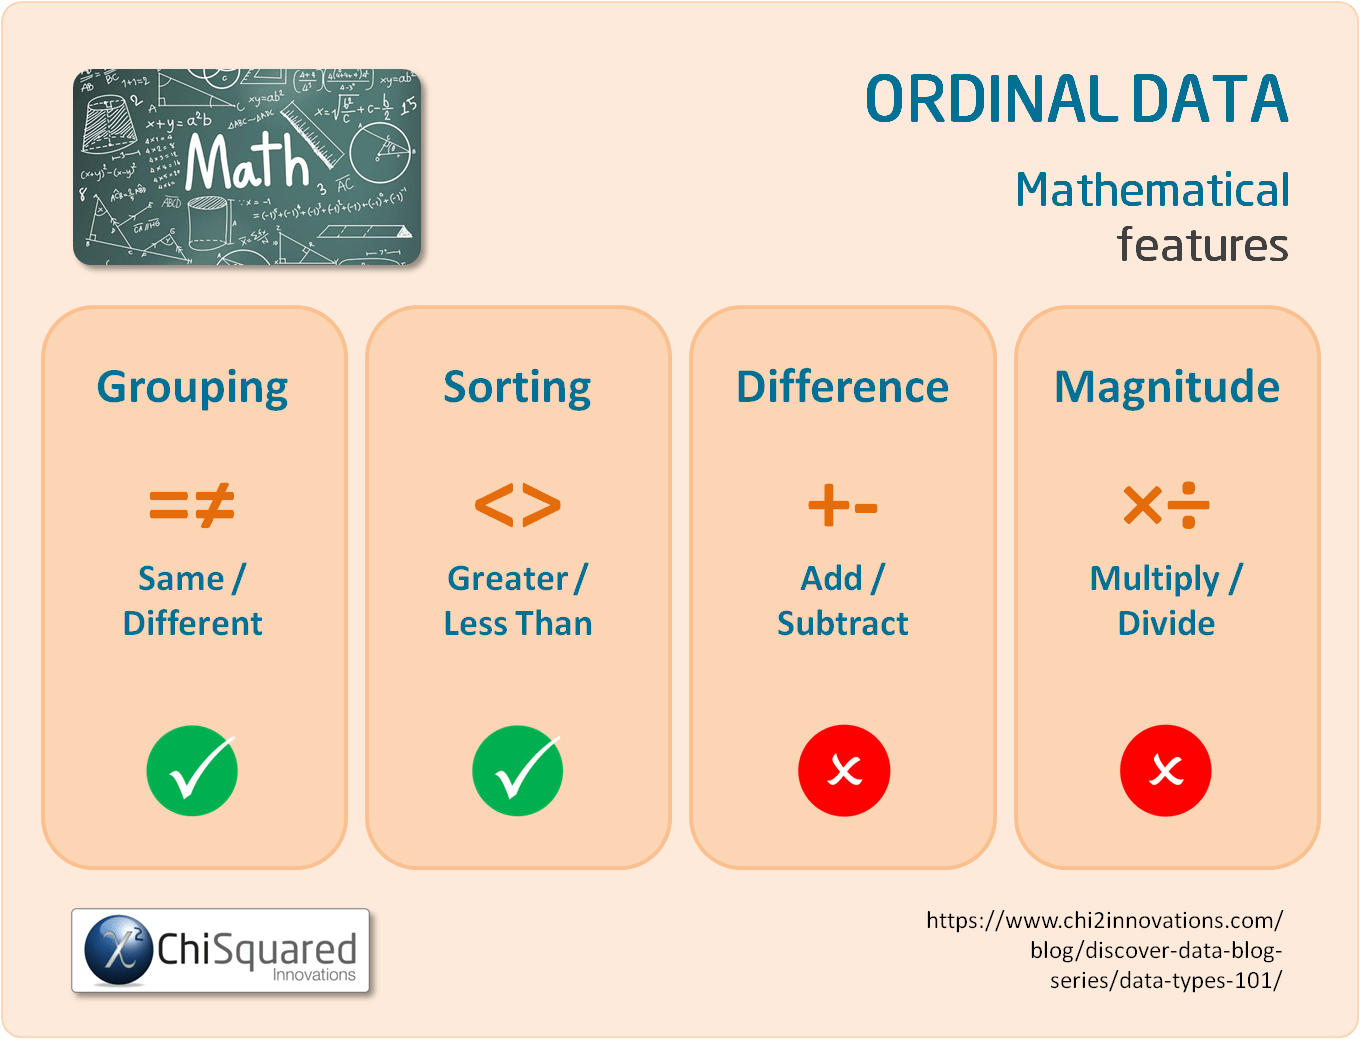
For example, you can group people according to their socioeconomic status, but you can also sort them as well. Upper class is higher on the scale than Middle class, which in turn is higher than Lower class.
3 Simple Questions...
What's Stopping You Reaching
YOUR Data Ninja Potential?
Answer 3 questions and we'll recommend the best route to
super-charge your data career
What Descriptive Statistics Can You Do With Ordinal Data?
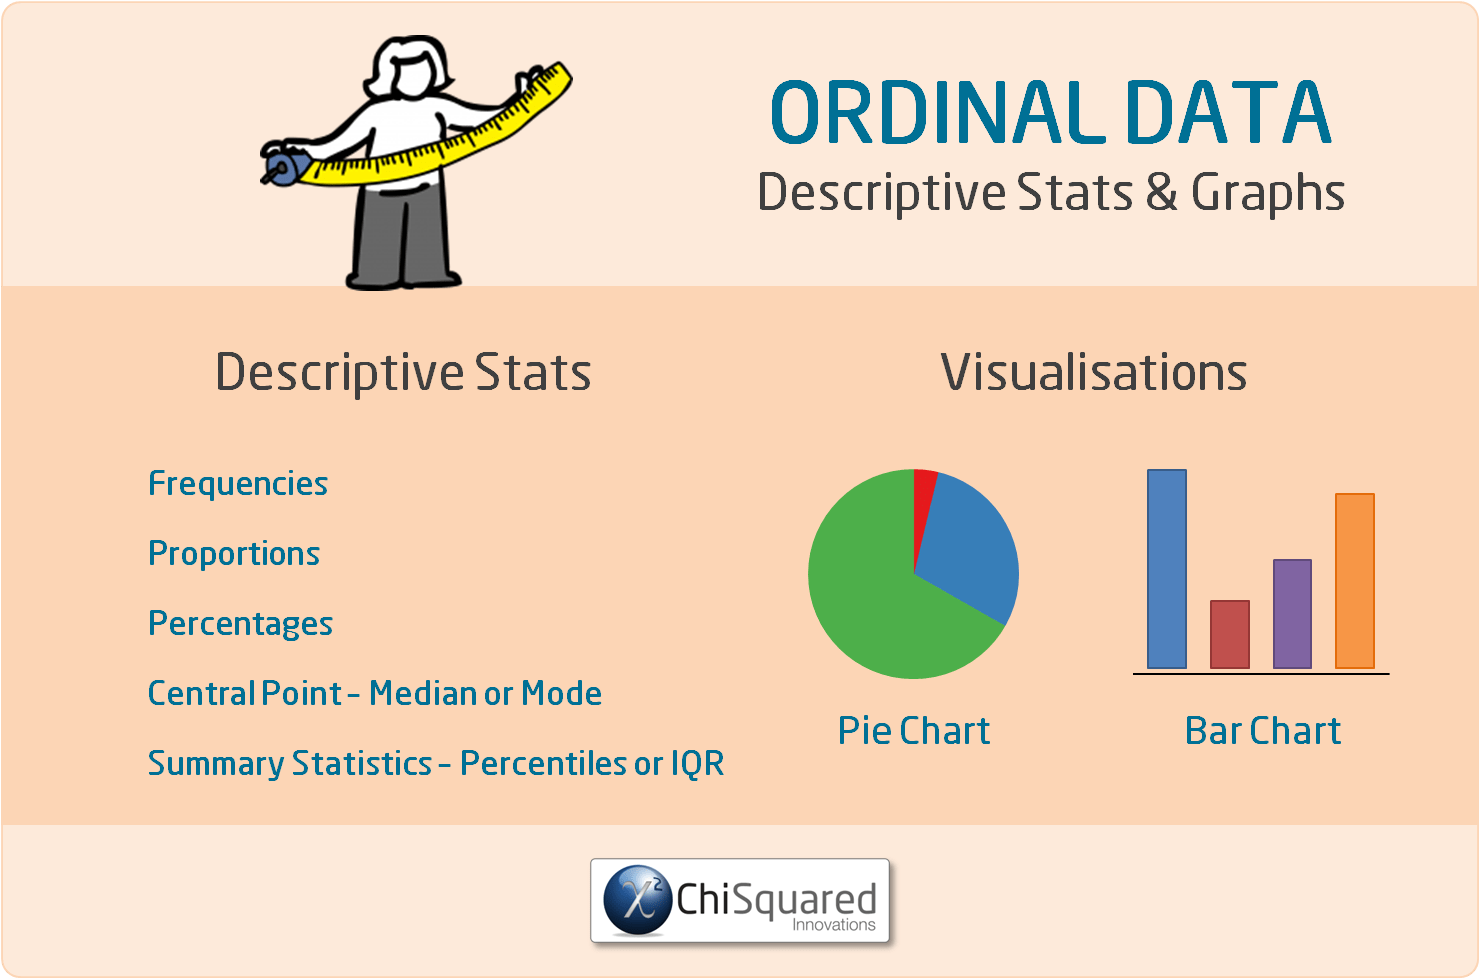
With Ordinal variables you can calculate precisely the same things as you can with Nominal variables, with a couple of extra things (see if you can spot them). That is:
Learn More About Statistics and Data with These Books:
What Data Visualisations Can You Do With Ordinal Variables?
As with Nominal variables, since the only descriptive statistics you can do with Ordinal data are frequencies, proportions and percentages, the only ways to visualise these are with pie charts and bar charts.
Ordinal Data Also Make Great Dummy Variables!
By now you might be wondering whether you can create dummy variables with Ordinal data. Well, you can!
It can be slightly different with Ordinal data, though, because their categories are ordered. Instead of choosing a category, you would usually use a cut-off value and base your dummy variable around that.
Let's look at an example. Say you have ages categorised as 20's, 30's, 40's, 50's and 60's, and you suspect that your data are different for those 50 and above. Here, you would code all ages below 50 as 0 and all ages 50+ as 1. You now have a dummy variable, and you can analyse it using all the same techniques as you would a dummy variable created using Nominal data.
Ordinal variables are very common in surveys and questionnaires, and the Likert scale is one example of collecting Ordinal data.
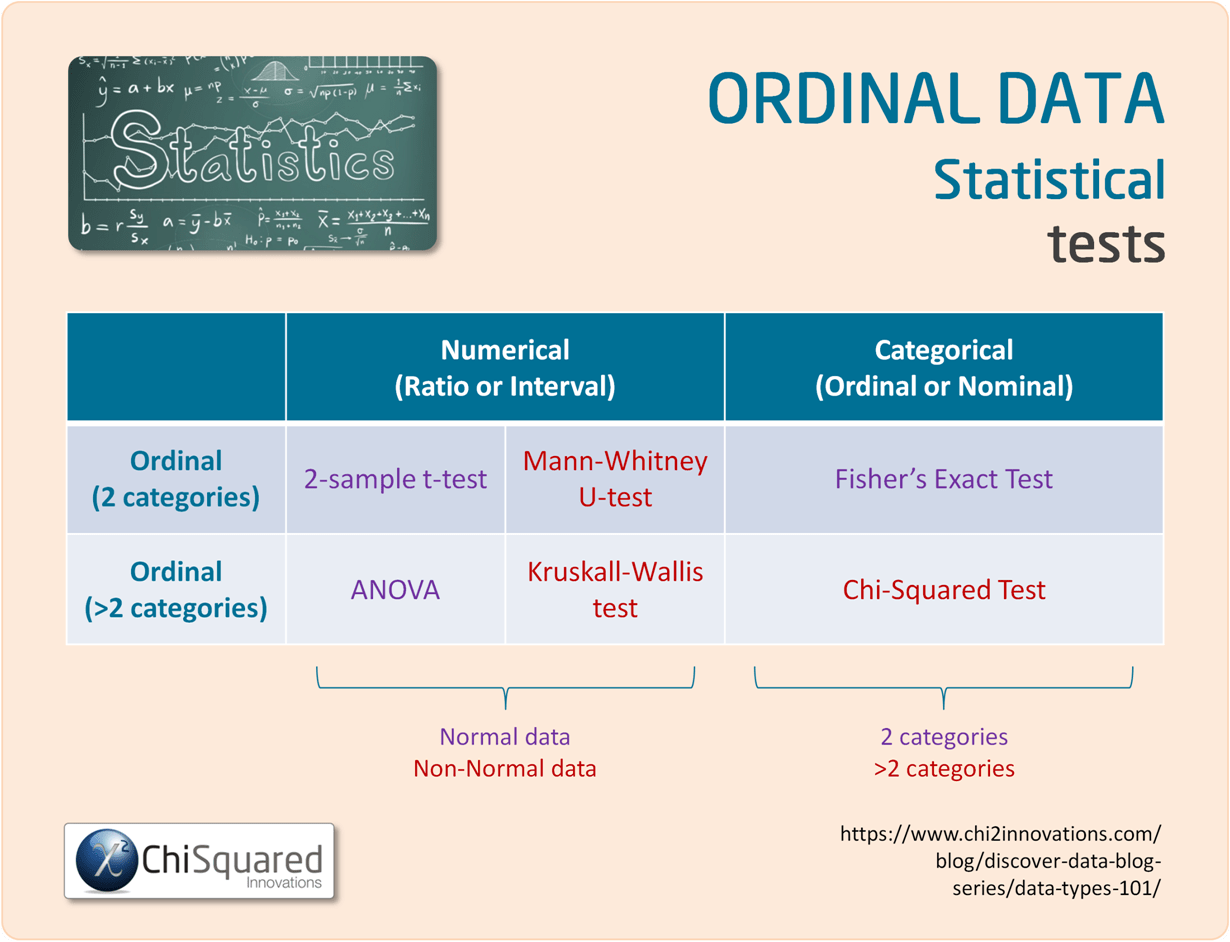
You can use Ordinal variables in non-parametric hypothesis tests that rely on ranking, such as the Mann-Whitney U-test or the Wilcoxon Matched-Pairs test.
Ordinal Data - What Is It, And How Do You Analyse It? Everything You Need To Know (And More) @chi2innovations #dataanalytics #datatypes #statistics
What Statistics Can You Do With Ordinal Variables?
Ordinal variables can be used in precisely the same statistical hypothesis tests as Nominal variables. Actually, that's not quite true - there are some additional tests you can use with Ordinal variables, but they are more advanced and are beyond the scope of this article. If you want to know more, you can look up the Chi-Squared For Trend Test, Ordinal Logistic Regression and Nominal Logistic Regression.
For now, just know that for the pairwise tests, you can treat Ordinal variables and Nominal variables exactly the same.
Ordinal vs Nominal Data - What is the Difference?
Ordinal data and Nominal data are both qualitative data, and the difference between them is that Nominal data can only be classified - arranged into classes or categories - whereas Ordinal data can be classified and ordered.
One of the assumptions of Ordinal data is that although the categories are ordered, they do not have equal intervals.
It is interesting to note that in practice some Ordinal data are treated as though they do have equal intervals because the statistical tests that can be used on these data are much more powerful than those typically used on Ordinal data. This is OK as long as your data collection methods ensure that the equidistant rule isn't bent too much.
Tumour Grade [1, 2, 3] is a classic example of this in healthcare.

UNIQUE VIDEO COURSE
In less than 2 hours
your data can be:
Ordinal Data: Summary
The basics of statistics, like data collection, data cleaning and data integrity aren't sexy, and as a result are often neglected, and that is also the case with data types.
In my experience, few people that have to do statistics as part of their research know and understand the statistical data types, and as a result struggle to get to grips with what they can and can't do with their data.
That's a shame, because as you've seen, if you know the 4 types of data in statistics you know:
In short, data types are a roadmap to doing your entire study properly.
They really are that important!
Hopefully, by now you have a good understanding of what Ordinal data are, and what you can do with them.
Ordinal Data are observed, not measured. They are ordered but non-equidistant and have no meaningful zero. Categories are named, and once data are grouped you can sort them.
Ordinal data are types of Qualitative data (also known as categorical data), and you cannot perform any mathematical operations on Ordinal data.
Now that you know everything there is to know about Ordinal data, you might also like to read this post's sister articles on quantitative data and qualitative data, Nominal data, Interval data and Ratio data.
In the final posts we'll compare each of the 4 types of data and I'll also show you how to choose the correct statistical hypothesis test.
Do you have any questions about Ordinal data? Is there something that I've missed out?
Let me know in the comments below - your feedback will help me to improve the post and make learning about data and statistics easier for everybody!
This post forms part of a series on the 4 types of data in statistics.
For more detail, choose from the options below:

