Sometimes, when analysing your data the visualisation that you choose can end up as being a bit of an afterthought.
After all, you’ve got your answer, so why waste time playing around with graphs when you can just get out there and change the world!
Well, I guess you know the answer already – it’s the graph that will change the world, not the numbers that sit behind it.
But only if done correctly!
More...
Pin it for later
Need to save this for later?
Pin it to your favourite board and you can get back to it when you're ready.
Disclosure: This post contains affiliate links. This means that if you click one of the links and make a purchase we may receive a small commission at no extra cost to you. As an Amazon Associate we may earn an affiliate commission for purchases you make when using the links in this page.
You can find further details in our TCs
Unless you’ve been living under a rock for the past couple of decades it shouldn’t have escaped your attention that there’s quite the debate raging about climate change, whether the planet is warming and whose fault it is. Whether you choose to believe that the fault lies with man, cow farts or blue-green algae, the fact is that the planet is warming.
We know that that’s true because of this graph that shows how the world has been warming since the Industrial Revolution:
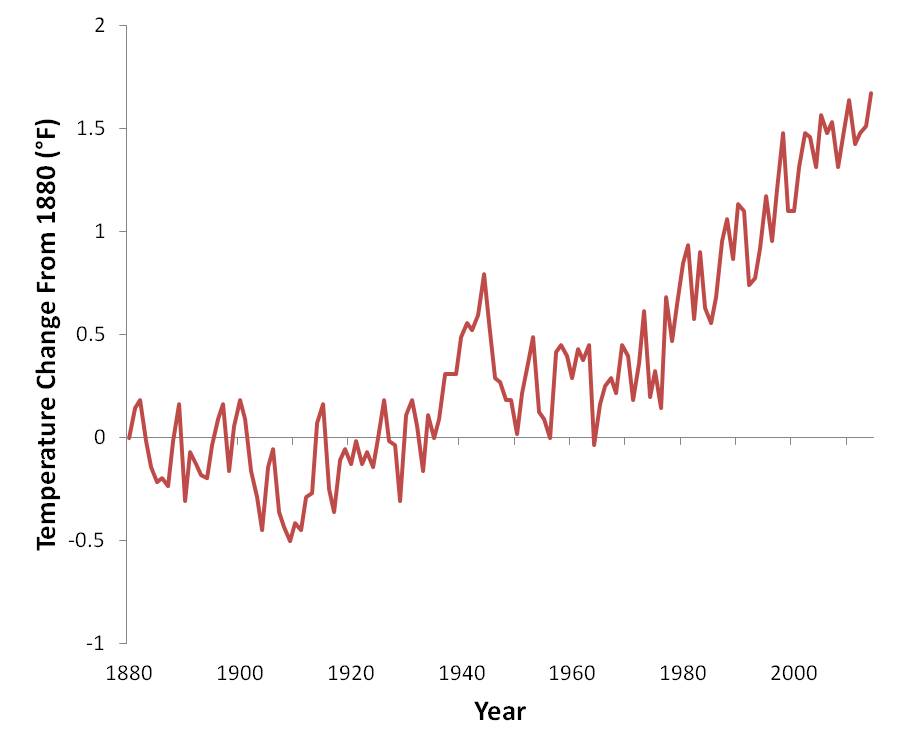
Quite how anybody can look at this graph and claim with a straight face that the planet isn’t warming is beyond me.
And yes Donald “How Can The World Be Warming When It’s So Cold Today?” Trump, I’m looking at you!
That’s like saying “how can there be a global recession when I’m so rich” or “how can there be so little water in Africa – there’s plenty when I turn on the tap…”.
Anyway, I digress.
OK, so the point is made – graphs are important and they deserve all the respect we can give them. But is there really a sure-fire way to make sure that the graphs we choose are appropriate for the situation, give context to the underlying data and convey the story of the data truthfully and accurately?
Why, yes, yes there is!
And that’s where we’re going right now…
How to Lie With Numbers, Stats and Graphs
A Box Set Containing Truth, Lies & Statistics and Graphs Don't Lie
Truth, Lies & Statistics and Graphs Don't Lie are two of our biggest selling books – and by far our funniest!
In these eye-opening books, award-winning statistician and author Lee Baker uncovers the key tricks of the trade used by politicians, corporations and other statistical conmen to deceive, hoodwink and otherwise dupe the unwary.
Discover the exciting world of lying with data, statistics and graphs. Get this book, TODAY!
But don’t expect the answer to be a simple one.
You did, didn’t you? Hands up all those that thought this would be easy!
Well, actually, it isn’t that difficult, but it is a process that will take time, patience and perseverance.
You see, data analysis is more about the journey than the destination. Your data is trying to tell you a story, but you need to learn how to listen:
Once Upon A Time...
There Was A Beautiful Princess
The End
Well it’s a story alright, but it doesn’t really paint an enduring picture, does it?
It needs more. A dragon, a castle and an eager knight who turned out to be a prince in disguise after all. Maybe even an evil queen, a travelling salesman and an angry elephant.
There. Isn’t that better? Is the picture in your mind getting bigger, fuller and rosier now?
Creating a graph – the right graph – that paints a lasting image in your mind is very much like writing the princess-in-distress novel. It takes attention to detail and an eye for making sure that what is seen is just what needs to be seen to tell the story of the data, and no more.
I’m still talking about a graph that tells the truth here, but one that gives your audience the precise context that is needed to ‘read’ the graph correctly with a single glance.
3 DATA VISUALISATION BOOKS YOU'LL LOVE
Introducing… Some Data
OK, so let’s have a look at some data and see how we can find a visualisation that does it justice.
Let’s say that we have a medieval salesman travelling around the country selling, er, I don’t know – magic pixie dust. His boss, the evil queen, wants to know if her idiot minion is getting to his appointments on time to sell her magic pixie dust (which is actually just snake oil in disguise).
Obviously, if he’s consistently late, he will pay for it with his head. That’s where the elephant comes in…
Every day he is given a medieval parchment with his appointment times scribbled on it in the blood of her enemies. At each sales meeting he records his arrival time in an app on his iPad, which uploads the data in real time to an evil database via the cloud, where the queen’s personal Data Science elf can compare the expected with the actual arrival times.
The evil queen may be a traditionalist, but she’s nothing if not efficient…
Got the back-story?
OK – let’s begin.

DataKleenr - All Your Data Cleaned in Minutes
Completely automated - DataKleenr is the fastest cleaning program on the planet!
Use Scatter Plots to Visualise All Your Data
Let’s start by having a look at the data. The first thing we should do is plot the data on a scatter plot to see if there are any obvious patterns that jump out at us:
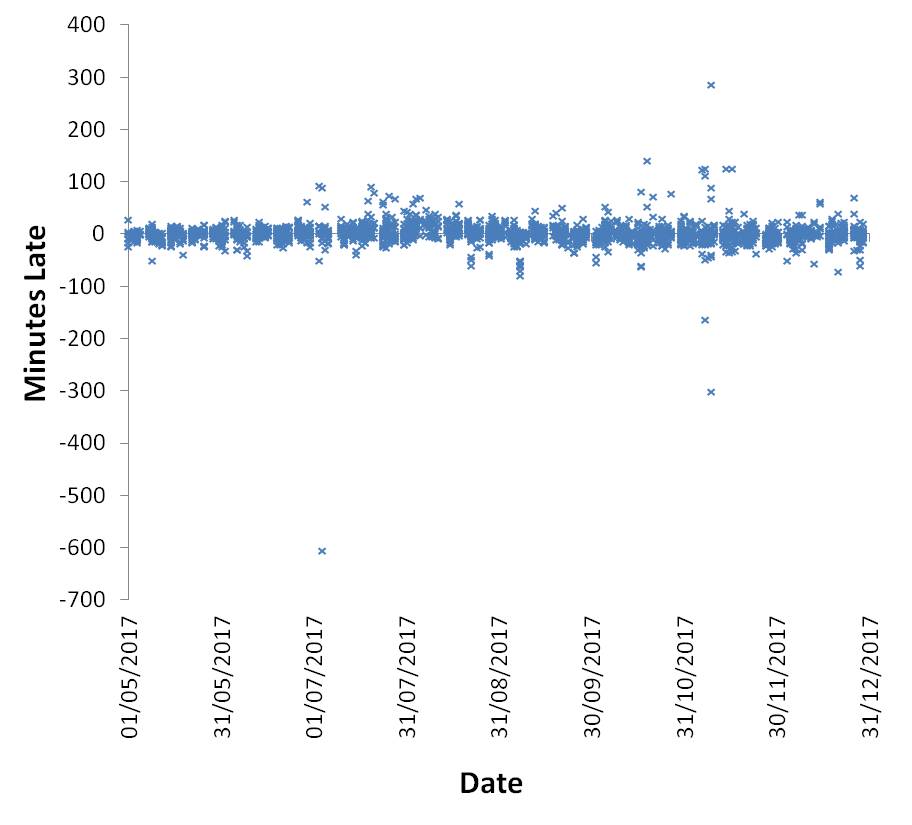
The first thing to notice is that there are a few extreme values that are stopping us from getting a really good look. So what should we do with these values? Should we keep them in and analyse the data regardless, or consider them as evil (statistical outliers) and obliterate them entirely by the judicious use of an angry elephant (exclude them from the study)?
In terms of a travelling medieval salesman, a seasoned professional would never arrive to a sales pitch hours early or late, especially as he knows that the status of his head depends on it. He would be much more likely to send word ahead with one of the evil queen’s flying monkeys, explaining that his carriage had broken down in the cruellest of circumstances (probably due to a leaf on the track), and can we please re-schedule for later in the afternoon?
Given the cowardice professionalism of the hero of our story, I decided to exclude any visit that was 2 hours early or late, on the basis that the visit was likely re-scheduled and the data, therefore, inaccurate and misleading.
So now let’s go ahead a do a Scatter Plot of the new data:
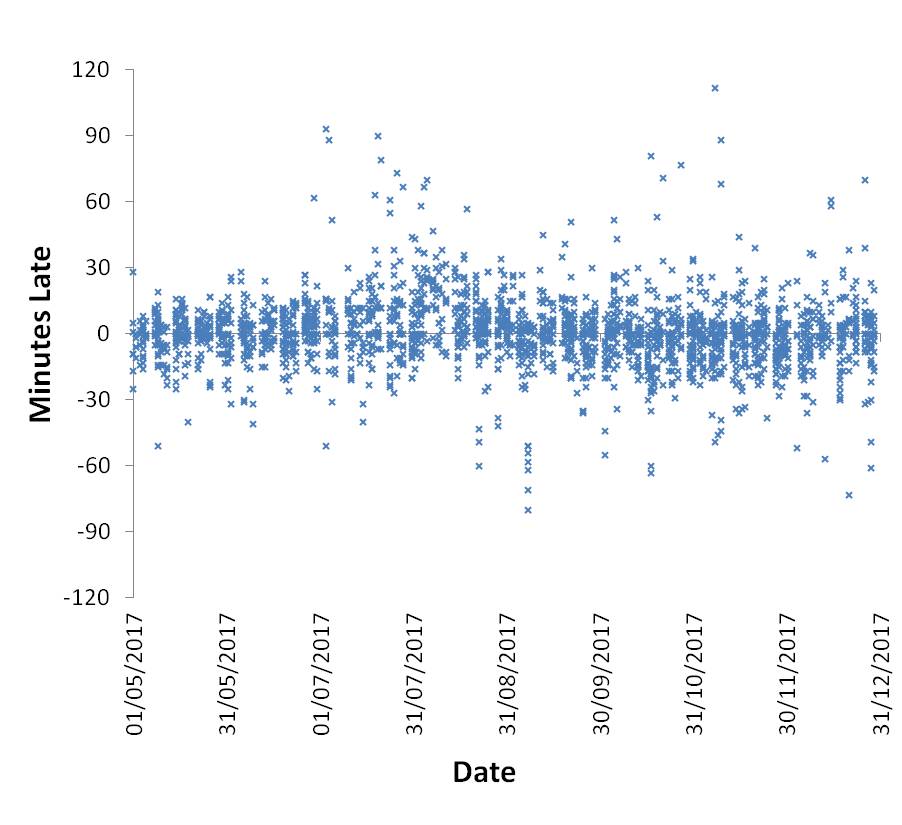
That’s a little bit better, but can we really see an obvious pattern or trend in the data? Something the Data Science elf can get excited about? Is it something he can comfortably take to the evil queen and use it to bargain for a raise?
No. Not even close. It’s not a graph that sets pulses racing, that’s for sure…
What we have here is a lot of noisy data. We need to be able to cut through the noise so we can see the signal more clearly, and one of the best ways of doing that is to aggregate the data in categories.
Histograms Are Great For Visualising Counts in Aggregated Data
The easiest way to aggregate the data is by counting how many times our downtrodden trader was early, how many times he was late and how often he was on time. We can then plot these on a Histogram (also known as a vertical bar chart or a column chart), like this:
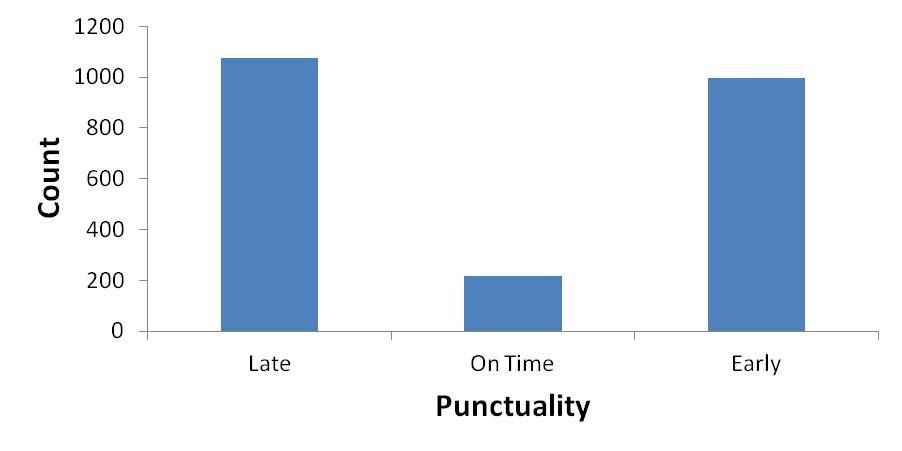
Hmm, very interesting. It seems as though the salesman is mostly early or late and rarely turns up on time. That’s not good!
Now here’s the thing – graphs don’t lie. But evil Data Science elves do. Graphs will plot the data in exactly the way that you tell them to without caring what the consequences are. In this case, the ‘On Time’ data are exactly that – our salesman turned up precisely on time. Not a minute early and not a minute late. That’s not very realistic.
If we want the data to properly represent the reality on the ground then we should be a bit more tolerant of the salesman being a few minutes early or late. Also, in this model there’s no difference between the salesman being 1 minute late and 2 hours late. Practically, there is a huge difference.
So we need a new model.
Instead of having 3 categories, let’s try 7 categories, and we’ll tolerate the salesman arriving within 5 minutes of his scheduled time (but don’t tell the queen). This is what we get:
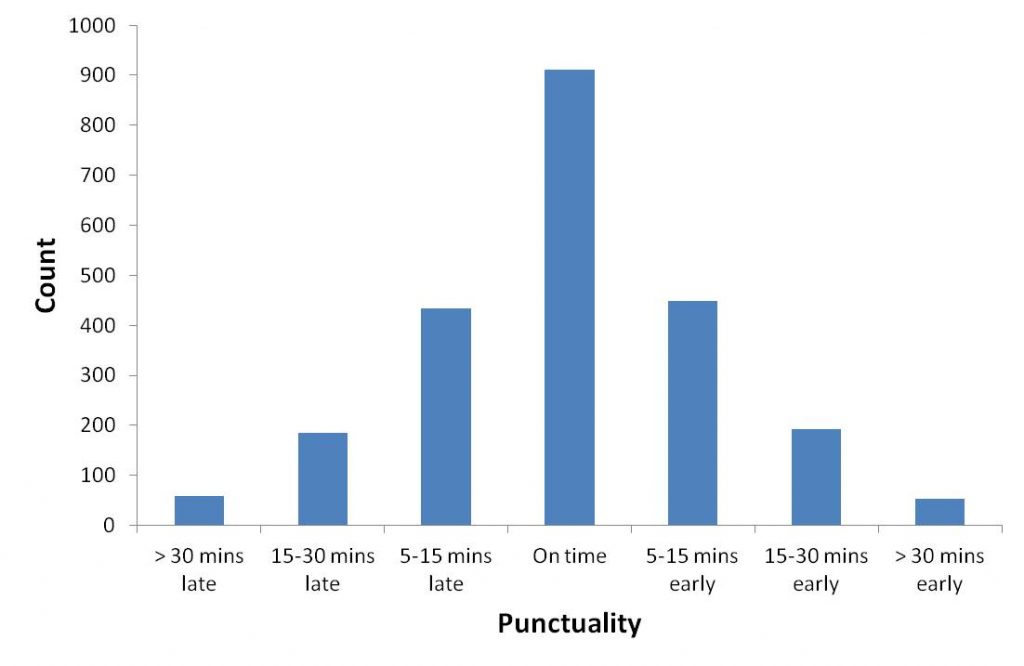
Wow – that looks great. The graph is symmetrical and normally-distributed. That’s a fabulous result. It’s everything an elf dreams of – data that behaves itself and doesn’t fight back.
So why did I choose 7 categories when 9, 11 or 13 would do just as well? Actually, there wasn’t a good reason to choose 7. I just did. I tried 3 and 5, but 7 gave a nice result with plenty of data in each bin (so any results I get will be robust), and I didn’t go any further.
When you categorise data like this you need to choose how many ‘bins’ you’re going to put your data into, and the number of bins usually depends on the range and the number of observations in your dataset. If you really want to be strict about it, then you can calculate the number of bins to use by Sturges’ formula, the Rice formula, Doane’s formula, the Freedman-Diaconis Rule or Shimazaki-Shinomoto’s choice.
Or you can bury your head in the sand and let your favourite stats program do it for you. As practiced by Data Science elves the world over for generations…
Incidentally, when I asked for a Histogram of these data in Minitab, it gave me 41 bins and an equally beautiful Gaussian curve, but there’s a very good reason why we don’t want to work with that number of bins, and it’ll become obvious very soon.
Histograms of Counts Can Get Complicated Very Quickly…
OK, so now we have a really good idea of what the salesman has been up to, it’s time to delve a bit deeper and really make him sweat...
Let’s now do the same thing as before, but look at the results by month. Here’s the graph:
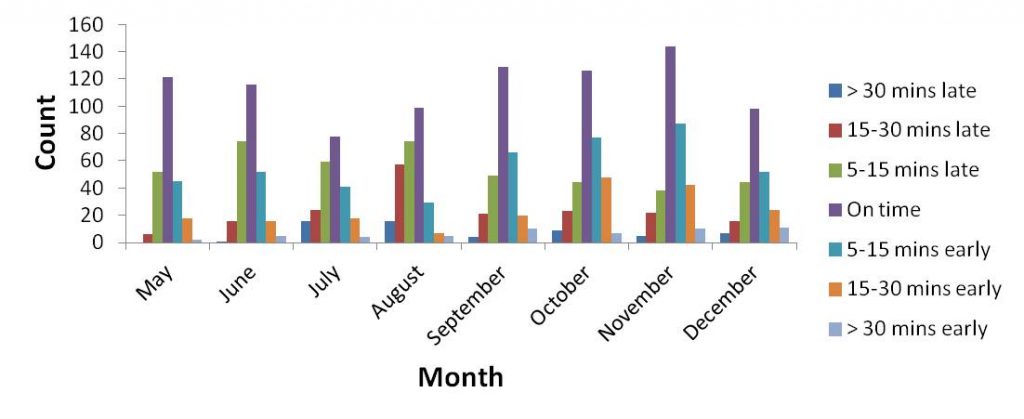
Oh dear, it’s starting to look really ugly now. There’s a lot of information here and we’re getting overloaded by it. Can you see any nice patterns emerging? No, me neither. There might be some and there might not, but it’s really difficult to tell.
Do you see now why I didn’t want to work with more than 7 bins? Just imagine what this graph would have looked like if I’d gone with Minitab’s suggestion of 41 bins. Urgh!!
And Line Charts Aren’t Much Better Either…
Maybe if we change the type of graph it might be easier to see what’s going on. Let’s try a Line Chart instead:
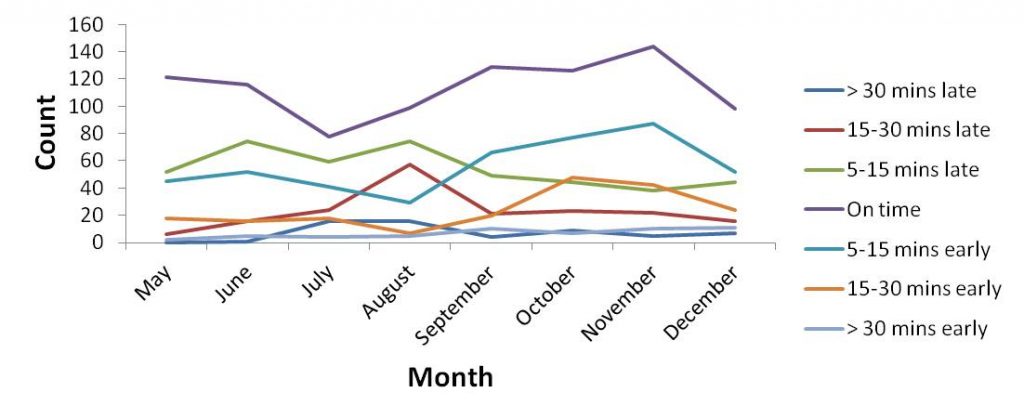
Well, it might be a little bit better, we can at least see some trends, but it’s still a mess.
It seems to me that it’s not the graph that’s the problem, but rather the way we’re analysing the data.
Yet again, we need a new model.
Be Mean – Find Your Centre!
If we look back to the monthly Histogram, there’s a clue in there about what our favourite Data Science elf might like to try next. Notice that each of the monthly distributions are normal. This means that rather than plot all of the data, we can represent each month by the mean.
Let’s plot that and see what it looks like:
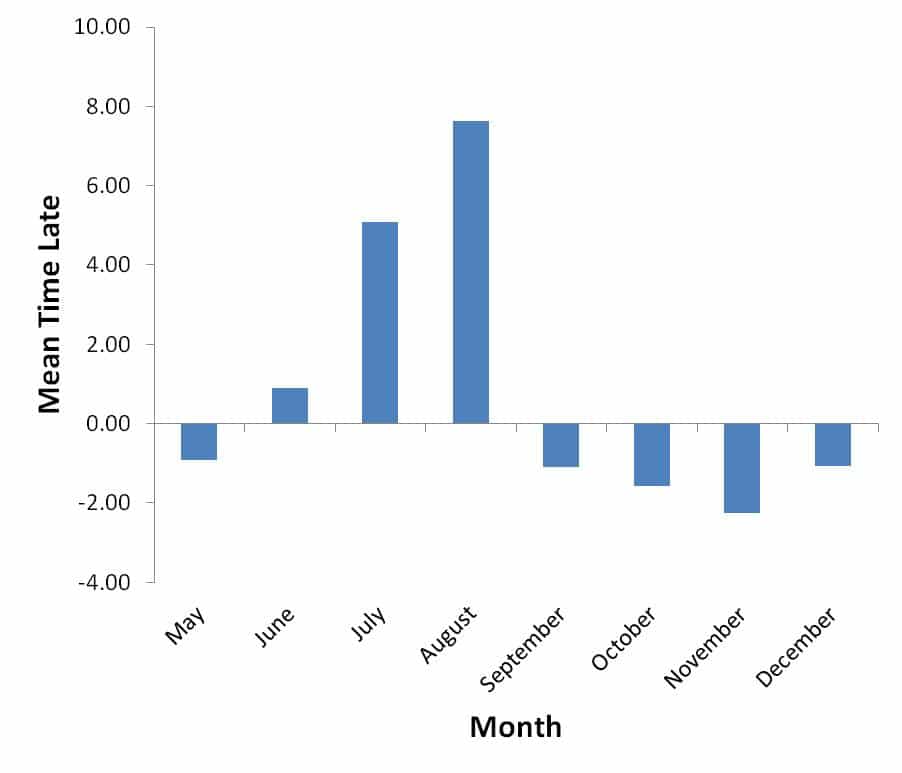
This graph tells us by how much, on average, the salesman is late (or early) in any given month. We have lost a lot of information by representing each month by a single number rather than 7 bins, but we’ve got a graph that still tells us a lot, and – better still – it looks nice. We can work with that!
VIDEO COURSE
Statistics:
The Big Picture
Free to try - no need to buy or register!
Don’t Be Mean – Spread It Out!
A few years ago I was working as a medical statistician in a large teaching hospital (no, I wasn’t an elf and there were no elephants), and one of my biggest missions was to persuade researchers not to bring me graphs like this. They tell you nothing.
“This mean is bigger than that one”.
Whatever dude…
“The difference between this mean and that one is huge”.
Sure it is, and I bet you didn’t manipulate the axes to accentuate that difference, did you…
The question we need to ask is whether the difference in means is a real difference, or whether it occurred by chance.
To explain, let me give you an analogy concerning two of the evil queen’s favourite dogsbodies.
Edmund is tall and thin, while Baldrick is short and broad, but they both weigh the same amount. You might wonder if the difference in the spread of their body masses is significant, whether Baldrick, the rotund gentleman, is significantly broader than the more slender Edmund.
The meaning of the word ‘significant’ is important here. We can test these guys by pointing them to a narrow gap in the fence and asking them to squeeze through. If Edmund gets through and Baldrick doesn’t, then Baldrick is significantly more portly than his friend.
This is significant because Edmund can escape the evil queen’s favourite angry elephant and live a long and fruitful life, whereas Baldrick doesn’t survive long enough to pass his genes to the next generation.
In other words, the details are important!
What I’m trying to get at is that the mean without a measure of the spread is meaningless – the confidence intervals give us the context that we need to make sense of the data.
Always Use Confidence Intervals
My biggest mission as an elf statistician all those years ago was to teach researchers to think not in terms of the central point of the data (mean, median, etc.), but in terms of the spread of the data. It might seem like putting confidence intervals on graphs is a geeky thing to do (spoiler alert: it is!), but if you want to convey the correct message rather than deceive your queen and risk the wrath of the elephant, then this is what you must do.
So let’s go again with the graph of the means, but this time put 95% confidence intervals on:
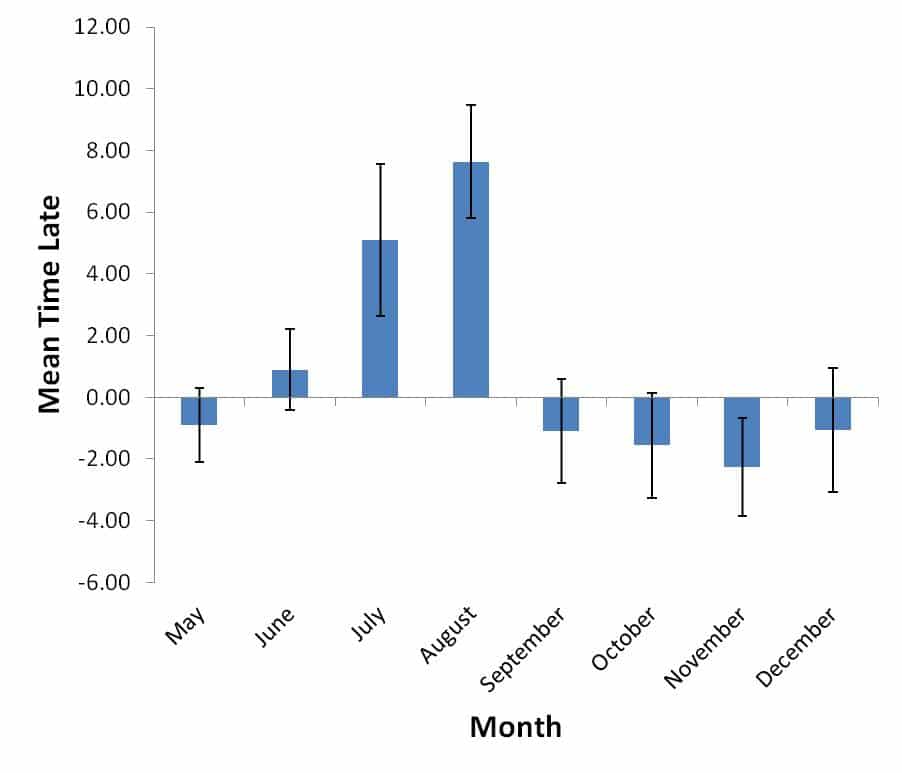
That’s better – now we can really see what’s going on with these data.
The next critical thing is knowing how to read confidence intervals.
Two things must ye know about confidence intervals:
- 1If there is a clear separation between the confidence intervals, there is likely to be a statistically significant difference between the means
- 2If a confidence interval does not straddle zero, the mean is significantly different from zero
Let me explain these two points from the opposite perspective:
- 1If there is an overlap between the confidence intervals, then the means are not significantly different from each other
- 2If a confidence interval straddles zero, the mean is not significantly different from zero
Interpreting The Results
Let’s put these into practice and compare the data for the months of May and June. For these months, the confidence intervals overlap and they both straddle zero.
This means that there is no difference between the average times for May and June, and that they are not different from zero. In practical terms, during May and June our salesman was (on average) bang on time, and his head is safe.
If we were to have looked at the heights of the plots for May and June we would not have come to this conclusion – we would have said that he was early in May, but late in June – his performance was slipping and the elephant would have been sent to limber up and do a few preparatory stretches.
The evidence does not support this conclusion though. The confidence intervals tell us that May and June were indistinguishable from each other.
*Phew*.
OK, let’s move on to July and August. These confidence intervals overlap, but neither of them straddle zero. Although the means are not significantly different from each other, they are significantly larger than zero. In other words, our under pressure salesman was consistently late in July and August.
Oh dear.
Note also that July and August were significantly larger than June.
Oh dear, oh dear.
Looking at the results from May to August it’s clear that there is a pattern emerging. Our salesman was becoming increasingly late in his sales visits during the summer months, after which he went back to his usual pattern of being on time.
He has a wonderful excuse, though. A Get-Out-Of-Jail-Free Card, if you will.
Our hero insists that he was increasingly late during the summer period because he had an increased burden of sales visits while his colleagues were away on holiday.
In other words, the bell tolls not for the salesman, but for the scheduler, or more likely the fool poor soul who decided that staff should be allowed time off for holidays. A frivolous pursuit that should not be tolerated, if you ask me…
Whatever the reason, it seems that our favourite pixie dust salesman will live to sell another day.

CorrelViz - All The Correlations in Your Data In Minutes, Not Months
Discover new insights - Save time and money
Quality is an Iterative Process
Whenever you read a journal article or a textbook (medieval or otherwise) and it takes you through an analytical process, it often leads you to think that the author must be really smart or you must be a bit dumb, because:
“it’s never that easy when I do it…”
Let me reassure you that it’s not so easy for any of us statisticians or Data Science elves either.
When you want to reach the correct conclusion, the path is never as straightforward as going from A to B. It’s often a convoluted path, and many times you’ll go down dead ends and have to go back to the beginning and start again.
For example, when analysing the data I didn’t start by doing a scatter plot (the first step above).
Nope, I jumped straight into other analyses first – some more sexy analyses, if indeed analyses can be described as being sexy…
"A data visualisation that captures imaginations and changes worlds is an iterative process that takes time, effort and a willingness to scrap it all and start again." #datascience #dataviz @eelrekab @chi2innovations
It was only after I realised that things weren’t working out nicely that I had to go back to the beginning and do things properly. It was then that I noticed there were issues with the data, and I needed to sort them out before I could progress.
Once I sorted out these issues I did a scatter plot and spotted some outliers that were messing up the analyses. So I had to deal with those too.
Then I investigated other avenues of analysis before abandoning them and trying something else.
Finally, after I had finished the analyses and all the results and graphs were complete I decided to zone in on the important information. I had done analyses for a whole year, but only the summer months had any actionable information in them, so I went back to the beginning and excluded January to April from the graphs.
And you were wondering why all the graphs started at May, weren’t you?
What you see in this blog post is the successful path. There were many unsuccessful paths, and it will be the same for you too.
My Biggest Data Visualisation Mistake
One of my biggest failures with these analyses was getting to the end and choosing a Box and Whiskers plot to show the distributions of the data (and notice that I had to switch to a different stats program to get it too!):
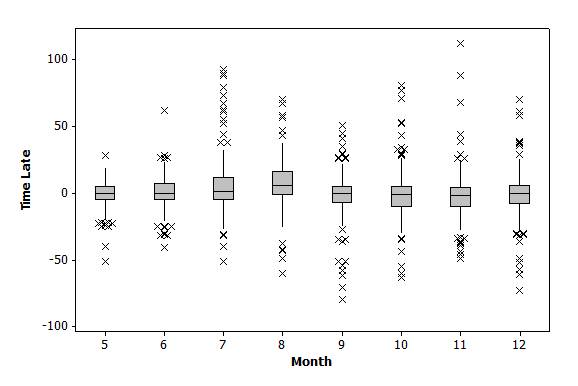
These plots correctly show the data in all their glory. There is the median, the Inter-Quartile Range, the maximum and minimum values, and all the statistical outliers. Fab!
Ah yes, but what can you tell from these plots? Can you see that our salesman was increasingly late during the summer months? Not really.
And can you make informed business decisions about scheduling? Absolutely not.
You see, choosing the correct data visualisation is more than just about showing the data. It’s about context and perspective.
Ask yourself what information you really need from these data, because choosing the wrong perspective gets the wrong person’s head squished!
Here, the Box and Whiskers plot contains too much data, and this is obscuring the valuable information that we need to see and make decisions from, so I simplified and plotted the means on a Histogram – with 95% confidence intervals of course!
This plot doesn’t contain as much information, but it does highlight the most important information that we need.
And critically, our hero remains intact. With a pulse to prove it…
Summary
The most important message here is that choosing the correct data analysis and visualisation methods are not always obvious.
A data visualisation that captures imaginations and changes worlds is an iterative process that takes time, effort and a willingness to scrap it all and start again.
And again, and again and again!
The End
Tags
data analysis, data visualisation, dataviz, numerical data, quantitative data, statistics, stats

