R Pipes simply blow me away! In this blog post I'll show you exactly why learning to program pipes in R will make a HUGE difference to your R programming and simplify your R code.
More...
Disclosure: we may earn an affiliate commission for purchases you make when using the links to products on this page. As an Amazon Affiliate we earn from qualifying purchases.
Over a decade ago I tried (unsuccessfully) to learn how to program in R, but with help from a friend - Matt Dancho - I'm finally getting started.
If you didn't know, I'm writing my findings and experiences into a series of blog posts so you can follow along with my progress and maybe try out R programming for yourself.
This is the second post in a series of, oh, I've no idea how many, because I'm writing these as I go along.
I hope you'll join me on this journey, and if you'd like to start from the beginning, you can find the first post here:
Before We Get to R Pipes, Let's Catch Up...
So far I've installed R and R-Studio, but that didn't work on my PC, so I use R-Studio Cloud instead. It works in exactly the same way, so nothing lost there.
Then I installed the Tidyverse package, a collection of R programming packages designed for Data Science, imported three data tables, and learned how to join them together.
Then came R Pipes, which blew my mind - and if you haven't heard of them before, I'm sure they're going to blow yours too!
R Pipes is what this blog post is all about.
If you're in a hurry and want to learn how to program in R for Data Science in 7 weeks, Matt's course will teach you just how to do that.
And Matt's been kind enough to offer our readers a 15% discount.
What is the R Pipes Function?
R Pipes is a function that is probably unique to R programming, and is a way of creating a sequence of multiple operations, and you can put all sorts of things within pipes.
The function Pipes is included in the 'magrittr' package, which itself is included in tidyverse, so there's nothing new for me to import or install to use it.
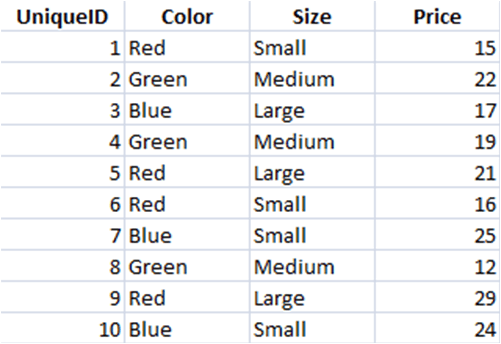
Let's say that we want to find the average price of red T-shirts in each size category. Here's what the data might look like:

And here are the steps that we follow to analyse these data:
- 1Filter the T-shirt dataset to only keep certain observations (e.g. Red only)
- 2Group the filtered data into categories (e.g. by the variable 'Size')
- 3Summarise the grouped and filtered data by calculating the average price
Creating Intermediate Steps
One way of coding this is to save each step as a new variable, like this:
myData_1 <- filter(dataset, Color == "Red")
myData_2 <- group_by(myData_1, Size)
myData_3 <- summarize(myData_2, price = mean(Price))
The problem here is that we have to name each intermediate object. Should I just add a number to the end or come up with some imaginative way of naming them?
Another problem here is what happens when we reference the wrong intermediate, like this:
myData_1 <- filter(dataset, Color == "Red")
myData_2 <- group_by(myData_1, Size)
myData_3 <- summarize(myData_1, price = mean(Price))
This would invariably give us the wrong answer, which we might not spot because the code still works and doesn't give us an error message.
Why Coding R Pipes in R Blew My Mind #datascience #rstats #tidyverse @eelrekab @chi2innovations
Overwriting The Original Variables
An alternative way of coding this is replace each variable with the new variable, like this:
Tshirts <- filter(dataset, Color == "Red")
Tshirts <- group_by(Tshirts, Size)
Tshirts <- summarize(Tshirts, price = mean(Price))
Here, we have the problem of sorting out what happens if we make an error in the middle of the operation. There is no way to rewind, and we would need to re-run the entire operation from the beginning
R Pipes To The Rescue
To code this with pipes in R, we use the pipe operator %>% between each operation in the sequence, like this:
Tshirts %>%
filter(Color == "Red") %>%
group_by(Size) %>%
summarize(price = mean(Price))
Here, pipes simply passes the output from the first line to the next line as the input, and so on to the end of the sequence. Adding new operations to the sequence is as simple as adding them into the pipe at the appropriate place. Wanna plot the average prices of the different sized red T-shirts as a Histogram? Add one line of code at the end of the pipe!
R Pipes are so intuitive that, not only do they make sense to a computer, they make sense to a human too, like this:
I got up %>% shaved %>% showered %>% showed up to work %>% goofed off all day
R Pipes - Summary
Until R Pipes came along, we were forced to create intermediate variables when building a sequence of operations, or overwrite the original variables. These were, of course, preferable to nesting the operations in a single line of horrible, unreadable code, but these were all unsatisfactory solutions.
Then along came R Pipes, and now you can see why R Pipes blow my mind!
Check Out The Course
If you're interested in learning R programming for business and follow along with me in this blog series, coding as you go, I highly recommend that you check out Matt's course. It's called Business Analysis With R, and you can check it out below.
with Matt Dancho
Coming Soon!
All posts in the series:


