Hey there, Data Ninjas! Get ready to dive into the enchanting world of descriptive statistics. Brace yourselves, because this is where the magic happens!
Discover more in this blog series...
Unleashing the Power of Descriptive Statistics: What's the Big Deal?
Alright, let's get real for a moment. You've got a mountain of data staring you in the face, and it's about as exciting as watching paint dry on a rainy day. Well, descriptive statistics is here to save the day! Think of it as your trusty sidekick, armed with the superpowers to unravel the story hidden within your data.
Cracking the Code: What Exactly are Descriptive Statistics?
Descriptive statistics is the process of summarizing and organizing data to unveil patterns, trends, and insights in a way that is easily understandable. It's like translating complex data into a language that everyone can comprehend, akin to a data superhero navigating through a forest of numbers to make sense of it all. Descriptive statistics acts as a fearless detective, revealing hidden gems and insights buried within vast amounts of data, akin to finding a needle in a haystack.
Unveiling the Tools of the Trade: Key Concepts in Descriptive Statistics
Descriptive statistics equips you with essential tools to navigate the data landscape. Think of mean, median, and mode as your trusty guides, leading you through the labyrinth of numbers. They shed light on the average, the middle ground, and the most frequent values, acting as statistical Sherlock Holmes, sniffing out clues to data enlightenment.
It's like a culinary masterpiece, where descriptive statistics transforms overwhelming data into bite-sized nuggets of insight. This art of summarization simplifies the complexity, making it easier to digest and uncover the juicy insights hidden within.
These measures of central tendency are the rock stars of descriptive statistics, highlighting the essence of your data. They serve as tour guides, navigating your numerical journey, pointing out highlights, and ensuring you don't miss a beat in deciphering the story within the numbers.
In the chaotic jungle of data, descriptive statistics acts as your trusty machete, cutting through the dense foliage to bring clarity. It helps you grasp the big picture, identify patterns, and make informed decisions, ensuring that you emerge victorious from the wild terrain of numerical analysis.
From Chaos to Order: Organizing Data with Descriptive Statistics Measures
Imagine your data as a wild beast, roaring and untamed. In this jungle of numbers, descriptive statistics measures step in as your trusty guides. Range, variance, and standard deviation act as the heroes, bringing order to the chaos and providing insights into the behaviour of your data.
These variability measures are like the spice that adds flavour to your statistical stew. They help you understand the spread, diversity, and quirky nuances of your data, transforming it from a wild beast into a manageable entity. Whether it's herding cats or organizing your sock drawer, descriptive statistics measures ensure that you have the tools to tame the unruly data and uncover its hidden patterns and insights.
Visualize to Mesmerize: Bringing Data to Life with Descriptive Statistics
Descriptive statistics isn't just about numbers—it's about visual storytelling! With captivating graphs, vivid histograms, and snazzy box plots, you can breathe life into your data.
More...
Disclosure: This post contains affiliate links. This means that if you click one of the links and make a purchase we may receive a small commission at no extra cost to you. As an Amazon Associate we may earn an affiliate commission for purchases you make when using the links in this page.
You can find further details in our TCs
Key Concepts in Descriptive Statistics
Alright, it's time to dive headfirst into the mystical world of key concepts in descriptive statistics. Don't worry, we'll guide you through this statistical maze like a torch-wielding wizard. Get ready to unlock the secrets!
Mean, Median, Mode: The Three Musketeers of Central Tendency
Meet the three musketeers of descriptive statistics: mean, median, and mode. Each possesses a unique superpower that contributes to unravelling the mysteries hidden within your data.
The mean, charming and smooth-talking, seduces you with its average value, offering insight into the overall trend. Meanwhile, the median, the middle child, provides a glimpse into the centre of your data, revealing the middle ground amidst the numbers. Lastly, the mode stands as the popular kid, showcasing the most frequently occurring value, highlighting the prevailing trend.
Together, they form an unbeatable team, embarking on a quest for central tendency—the pursuit of what's typical or average within your dataset. Like Sherlock Holmes and Watson, they meticulously analyze each data point, deciphering the mystery of central tendency and shedding light on the underlying patterns within your data.
Spread Your Wings: Measures of Variability Take Flight
Variability measures act as the wings that allow your data to soar to new heights. Whether it's the range, variance, or standard deviation, these measures provide insight into the diversity, spread, and dynamic fluctuations within your dataset.
Like a thrilling rollercoaster ride, variability measures take you on a journey through the ups and downs of your numerical landscape. They celebrate the vibrant tapestry of diversity present in your data, showcasing its differences and adding excitement to your analytical journey.
These measures are akin to the Spice Girls of statistics, bringing variety, spicing things up, and injecting a sense of adventure into your exploration of data. With variability measures at your disposal, you can navigate the twists and turns of your data with confidence, embracing its diversity and uncovering valuable insights along the way.
Seeing is Believing: Visualizing Your Data with Graphs
Statistics isn't just about numbers—it's about creating visually stunning representations of your data. With tools like histograms, box plots, and frequency tables, you can transform dry numerical information into captivating works of art.
These visualizations serve as the Picasso of statistics, bringing your data to life with vibrant colours and dynamic shapes. Prepare to be mesmerized as your data leaps off the page, telling its story in vivid detail.
Moreover, the artistic journey doesn't stop there. Shape and distribution play crucial roles in the visualization process. Imagine your data as a beautiful painting—what shape does it take? Skewness and kurtosis measures act as art critics, examining the brushstrokes and contours of your data, revealing whether it's symmetrical, skewed, or abstract.
Together, these visual and analytical tools allow you to not only see but also understand the artistic essence of your data, unlocking its secrets and unveiling its true beauty.
Frequency: Counting the Stars
Last but not least, we have frequency measures, the unsung heroes of descriptive statistics. They're all about counting the stars, or rather, the number of times a specific value appears in your data. They bring order to the chaos, giving you a clear picture of how often something occurs. Think of them as the statisticians with clipboards, keeping tabs on the data's every move.
Practical Applications: From Everyday Life to Scientific Discoveries
Alright, let's get real. Descriptive statistics isn't just a bunch of fancy concepts for mathematicians in ivory towers. Oh no! It's for you, me, and everyone else who wants to make sense of the world. From analysing sales data to understanding population trends, descriptive statistics has practical applications in everyday life and scientific discoveries.
Pin it for later

Need to save this for later?
Pin it to your favourite board and you can get back to it when you're ready.
Exploring Central Tendency Measures: The Quest for the "Typical"
Alright, it's time to embark on a thrilling quest through the enchanted realm of central tendency measures. Get ready to uncover the secrets of the "typical" and become a statistical hero in your own right. Let's dive in!
Mean: The Charming Smooth Talker
Ah, the mean! It's like that smooth-talking friend who always knows how to charm their way into the limelight. It's the average value that seduces you with its mathematical allure. But beware, the mean can be easily swayed by outliers, like a politician pandering to the popular vote. So, keep a keen eye and a sceptical mind when relying on this statistical Casanova.
Median: The Middle Child of the Pack
Now, let's meet the middle child of the central tendency family—the median. It's like the peacekeeper, always striving to find balance in the numerical chaos. When you arrange your data in ascending or descending order, the median is the value that proudly stands in the middle, unaffected by extremes. It's the rock in the storm, offering a glimpse into the heart of your data.
Mode: The Popular Kid on the Block
Ah, the mode, the undisputed popular kid in the world of central tendency. It's like that cool kid at school who always stands out from the crowd. The mode reveals the most frequent value in your data, capturing the essence of what's hot and happening. It's like a trendy hashtag, trending and stealing the spotlight. But be warned, sometimes there can be more than one mode, leaving you with a statistical quandary.
So, armed with these central tendency measures, you have the power to unravel the story of the "typical" in your data. But remember, statistics can be a fickle friend, so approach them with caution and a sprinkle of scepticism.
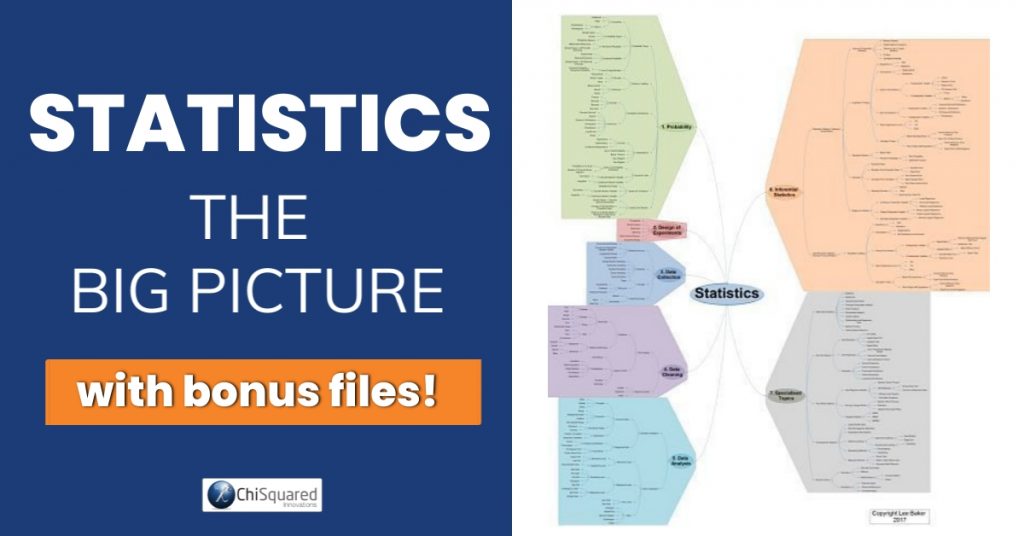
How to do Statistics - Do you know all 7 parts of the statistics universe? #statistics #datascience @chi2innovations
Unveiling Variability Measures: Embracing the Whims of Data
It's time to venture into the unpredictable realm of variability measures. Get ready to embrace the wild, the diverse, and the wonderfully wacky aspects of your data. Let's dive in and unlock the secrets of variability!
Range: From Peaks to Valleys
Picture this: your data is like a mountain range, with peaks and valleys stretching as far as the eye can see. The range measure is like a fearless explorer, revealing the distance between the highest peak and the lowest valley. It's a snapshot of the extreme ends, giving you a taste of the data's wild terrain.
Variance: The Rollercoaster Ride
Hold on tight, because variance is like a thrilling rollercoaster ride through your data. It measures the average squared deviation from the mean, showing you just how much your data loves to stray from the norm. It's like a mischievous child, constantly testing the boundaries of statistical order.
Standard Deviation: The Navigator of Chaos
Ah, the standard deviation, the trusty navigator in the chaotic world of data. It's like the guiding compass, showing you how much your data loves to wander off course. It quantifies the spread of your data points around the mean, helping you understand the quirks and idiosyncrasies that make your data unique. So, let the standard deviation be your North Star, leading you through the statistical wilderness.
So, armed with these variability measures, you're ready to embrace the whims of your data and unravel its true story. But remember, statistics can be like capricious companions, leading you down unexpected paths.
Understanding Distribution Measures: Peering into the Statistical Crystal Ball
It's time to delve into the enchanting realm of distribution measures. Imagine yourself as a mystical fortune teller, peering into the statistical crystal ball to uncover the secrets hidden within your data.
Skewness: Tilted Tales and Lopsided Legends
Ah, skewness, the teller of tilted tales and lopsided legends. It's like that eccentric storyteller who loves to add a twist to every narrative. Skewness measures the asymmetry of your data's distribution. Is it leaning towards the left, like a fashionista strutting on a catwalk? Or is it veering to the right, like a rebellious teenager breaking all the rules? Brace yourself, as skewness unravels the mysteries of your data's wondrous curves.
Kurtosis: Peaks, Valleys, and the Quest for Normality
Step right up, and witness the marvel of kurtosis—a measure that explores the peaks, valleys, and the very essence of your data's normality. Does your data's distribution resemble a perfectly symmetrical mountain range, or is it more like a bumpy rollercoaster ride? Kurtosis unveils the quirks and idiosyncrasies that make your data unique. So, prepare to embrace the deviations from the norm and let kurtosis be your guide on this statistical adventure.
Normal Distribution: The Holy Grail of Symmetry
The holy grail of statistical symmetry—the normal distribution. It's like finding a unicorn in a field of data points. The normal distribution is the gold standard, the benchmark of balance and order. It's like a perfect symphony, with data points dancing harmoniously around the mean. But beware, normality is a rare gem in the vast landscape of statistics.
So, armed with these distribution measures, you can peer into the statistical crystal ball and unravel the secrets of your data's distribution. But remember, statistics can be like a mischievous puzzle, hiding surprises at every turn.
Visualizing Data with Descriptive Statistics: Painting the Portrait of Your Data
In this section, we're going to unleash the magic of visualization and paint a captivating portrait of your data. Get ready to embark on a visual journey that will bring your data to life!
Histograms: The Artistic Splatter of Data
Imagine your data as an abstract painting, where every data point is a splash of colour on a canvas. Histograms are like the artistic splatters that capture the essence of your data's distribution. They reveal the frequency of data points within specific intervals, creating a mesmerizing display of peaks and valleys. It's like attending an avant-garde art exhibition, where each bar tells a unique story of your data's composition.
Box Plots: The Elegant Fashion Show of Data
Step onto the runway, as we dive into the world of box plots—the elegant fashion show of your data. These visual masterpieces showcase the distribution, variability, and even the outliers in your data. It's like a catwalk where your data points strut their stuff, with the median as the showstopper and the whiskers as the runway divas. So, sit back, relax, and enjoy the sassy display of your data's fashionable side.
Scatter Plots: Love, Connection, and Data Points
Ah, scatter plots, the playground of relationships, connections, and love stories within your data. They're like Cupid's arrows, revealing how two variables dance together. Each data point on the plot tells a unique tale of correlation or lack thereof. It's like attending a romantic ball, where data points twirl, intertwine, or drift apart. So, let the scatter plots be your matchmakers, helping you uncover the love stories hidden within your data.
So, armed with these visualization techniques, you can bring your data to life and uncover its hidden stories. But remember, statistics and visualizations can be like an abstract art form, open to interpretation and surprises.
Real-World Applications of Descriptive Statistics: From Data Ninjas to Statistical Superheroes
It's time to unleash the power of descriptive statistics in the real world. Prepare to don your statistical capes and soar through the skies of data analysis. Let's explore the incredible applications that turn you into statistical superheroes!
Business Insights: Unmasking the Secrets of Success
In the world of business, data is like a hidden treasure chest waiting to be unlocked. With descriptive statistics as your trusty map, you can uncover valuable insights that guide strategic decisions. From analysing sales trends to understanding customer behaviour, you become the detective, unravelling the secrets of success and steering your organization towards triumph.
Public Health: Fighting Villains of Disease
In the realm of public health, data is your superhero sidekick in the battle against disease. Descriptive statistics allow you to monitor the spread of illnesses, identify at-risk populations, and measure the effectiveness of interventions. Armed with statistical powers, you become the protector of communities, fighting villains like outbreaks and epidemics.
Education: Empowering the Minds of Tomorrow
As a Data Ninja in the field of education, you have the power to unlock the potential of every student. Descriptive statistics help you analyse test scores, track progress, and identify areas for improvement. You become the champion of knowledge, shaping the educational landscape and empowering the minds of tomorrow.
So, armed with the superpowers of descriptive statistics, you can make a real impact in various fields. From unravelling business mysteries to fighting diseases and empowering education, you have the ability to change the world one data point at a time. In our next section, we'll conclude our journey through the captivating world of descriptive statistics.
Discover more in this blog series...
Summary: Embracing the Magic of Descriptive Statistics – You're a Data Wizard Now!
Congratulations, you've journeyed through the enchanting world of descriptive statistics and unlocked its magical secrets. You've tamed the wild data beasts, harnessed their powers, and emerged as a true data wizard. It's time to reflect on your newfound statistical prowess and bid farewell to this captivating adventure.
Unveiling the Story of Your Data: The Power of Descriptive Statistics
In this blog post, we've unravelled the story of data together. We've dived into the depths of descriptive statistics, explored key concepts, and mastered various measures. You've learned how to wield histograms, box plots, and scatter plots like a pro, transforming raw numbers into captivating visual tales. With each step, you've become more confident in deciphering the story that your data yearns to tell.
From Data Chaos to Statistical Bliss
Remember when data used to look like an indecipherable mess? Those days are long gone. Armed with descriptive statistics, you can confidently navigate through the vast sea of data, transforming chaos into statistical bliss. You've tamed the statistical beasts and embraced the quirks and nuances that make your data unique.
Unlocking Possibilities: Where Data Meets Insights
Descriptive statistics isn't just about numbers and graphs; it's about unlocking the possibilities that lie within your data. You've discovered how descriptive statistics opens doors to valuable insights, empowering you to make informed decisions, whether in business, public health, education, or beyond. The power is in your hands to create a positive impact in your chosen field.
Continue Your Data Journey
But wait, the adventure doesn't end here! Descriptive statistics is just the beginning of your data journey. It's time to expand your horizons, delve into inferential statistics, predictive modelling, and beyond. The world of data is vast and ever-evolving, and as a Data Ninja, you're equipped to conquer new statistical frontiers.
So, take a moment to celebrate your accomplishments. You've unlocked the magic of descriptive statistics, armed yourself with statistical superpowers, and embarked on a journey of data discovery. Embrace the power, continue your quest for knowledge, and let your data stories unfold.
Keep exploring, keep analysing, and keep embracing the story of data.
Statistics - The Big Picture: PDF Download
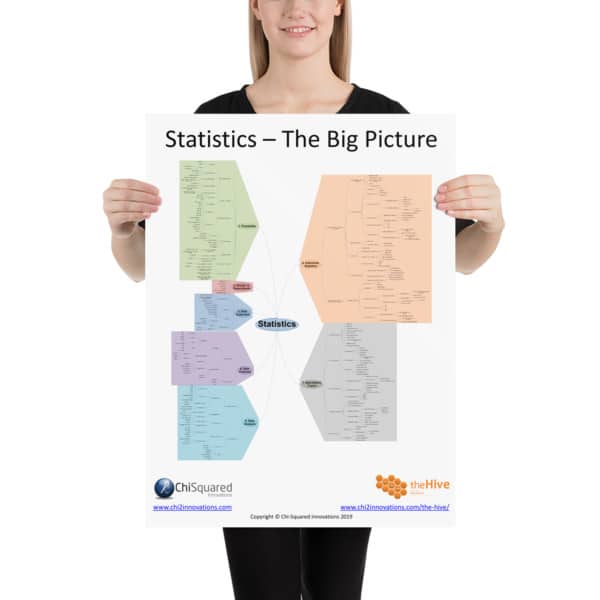
In Statistics - The Big Picture I delve deep into each of these 7 sections so you can see where all the different parts of stats fits in relation to everything else. It helps you to plan every element of your study from beginning to end so you can plot a route through The Big Picture, leaving nothing to chance in your research.
If you want your very own Statistics - The Big Picture to download and keep, you can get an Ultra HD pdf right here (with 50% off!):


