Alright, Data Ninjas, get ready to dive into the wild world of probability theory! It's the secret sauce that adds that extra zing to data analysis and statistics. So, grab your calculators and let's unlock the mysteries of uncertainty.
Discover more in this blog series...
What's the Deal with Probability Theory Anyway?
You know how life is full of uncertainties? Well, probability theory is here to help you make sense of it all. It's like a trusted sidekick that equips you with tools to handle the randomness and chaos lurking in your data.
Rolling the Dice: Basic Concepts Unveiled
Let's start with the basics, shall we? Probability theory revolves around understanding the likelihood of events occurring. We're talking about tossing coins, rolling dice, and even predicting the weather. It's all about quantifying the chances of different outcomes.
From Bell Curves to Skewed Distributions: Probability Distributions Explained
Ah, probability distributions. They come in all shapes and sizes, just like your funky collection of mismatched socks. From the symmetrical bell curve to the wacky skewed ones, these distributions give you a glimpse into the spread and patterns of your data.
Statistical Inference: Unmasking the Hidden Truths
Once armed with probability theory, you become a statistical Sherlock Holmes. You can draw meaningful conclusions about your data and make informed decisions. It's all about making logical leaps from sample data to the big picture.
Hypothesis Testing: Putting Claims to the Test
Hypothesis testing is your superpower to evaluate claims and separate fact from fiction. It's like a courtroom drama, where you challenge the status quo and demand evidence. With probability theory by your side, you'll be the judge of statistical significance.
Sampling Techniques: Collecting Data with Finesse
Data collection is an art. Probability theory provides you with nifty sampling techniques to gather data that accurately represents your target population.
Alright, we've just scratched the surface of probability theory's role in data analysis and statistics. Stay tuned for the next part, where we'll explore more mind-blowing concepts. Remember, with probability theory on your side, you'll be crunching numbers like a seasoned pro in no time!
More...
Disclosure: This post contains affiliate links. This means that if you click one of the links and make a purchase we may receive a small commission at no extra cost to you. As an Amazon Associate we may earn an affiliate commission for purchases you make when using the links in this page.
You can find further details in our TCs
The Basic Concepts of Probability Theory
Alright, Data Ninjas, time to sharpen those analytical skills and delve into the thrilling realm of probability theory. Don't worry, we'll guide you through this maze of probabilities with a healthy dose of sarcasm and a sprinkle of charm. So, strap on your Ninja gear and let's get started.
The Odds Are in Your Favour: Understanding Probabilities
You've probably heard the term "probability" thrown around like confetti at a party. Well, guess what? It's time to make sense of it all. Probability is like that friend who tells you the chances of something happening. Whether it's flipping a coin or predicting the outcome of a football match, probability gives you the inside scoop on the odds.
Events and Sample Spaces: The Building Blocks of Probability
Ah, events and sample spaces, the dynamic duo of probability theory. Events are like the stars of the show, representing the outcomes we're interested in. Sample spaces, on the other hand, are the cool kids that encompass all possible outcomes. Together, they form the foundation of probability theory, unlocking a world of data analysis possibilities.
A Roller Coaster of Numbers: Probability Distributions
Get ready to ride the roller coaster of probability distributions, Data Ninjas. Imagine a carnival with different rides representing different probability distributions. From the normal distribution's smooth sailing to the wild ride of skewed distributions, these babies reveal the patterns and spread of your data like no other.
Probability Rules: Laws That Keep It All Together
In the world of probability theory, there are rules to abide by. These laws, like the bouncers at a posh club, ensure that everything runs smoothly. From the Addition Rule to the Multiplication Rule, they dictate how probabilities combine and interact. Knowing these rules is like having a secret handshake that opens doors to deeper analysis.
Alright, you've now donned your Ninja gear and gained a taste of the basic concepts of probability theory. Stay tuned for our next installment, where we'll uncover more hidden treasures in the data analysis and statistical world. Remember, probabilities are your trusty sidekicks on this journey, guiding you through the unpredictable and making you the master of uncertainty!
Pin it for later

Need to save this for later?
Pin it to your favourite board and you can get back to it when you're ready.
Probability Distributions: Understanding the Spread of Data
Alright, Data Ninjas, it's time to unleash your inner probability master and dive into the captivating world of probability distributions. Think of them as the hidden gems that reveal the secrets of data spread. So, buckle up, grab your throwing stars!
Roller Coasters and Data: The Thrills of Probability Distributions
Imagine probability distributions as thrilling roller coasters, each with its own twists and turns. Just like a roller coaster ride, probability distributions take you on a wild adventure through the ups and downs of data. They help you understand the likelihood of different outcomes and how they're spread out.
The Bell Curve: Where the Magic Happens
Get ready to meet the superstar of probability distributions—the infamous bell curve, also known as the normal distribution. It's like the A-list celebrity of data analysis, showing up everywhere from human heights to exam scores. This symmetrical beauty provides insights into the central tendencies and variability of your data.
Skewed Distributions: The Rebels Among Us
Not all probability distributions play by the rules. Enter the rebels of the data world—skewed distributions. They come in two flavours: positively skewed and negatively skewed. These bad boys challenge the norm, with their lopsided shapes revealing fascinating insights into asymmetric data patterns.
Spread the Love: Variance and Standard Deviation
Want to measure how spread out your data really is? Say hello to variance and standard deviation, your trusty sidekicks. They quantify the extent to which data points deviate from the mean. It's like keeping tabs on how rowdy your friends get at a party—higher variance means more chaos and wider spread.
Taming the Distributions: Z-Scores and Standardization
It's time to tame those unruly distributions. Enter z-scores and standardization, your secret weapons. These techniques allow you to transform your data into a standardized form, enabling comparisons and identifying outliers. It's like putting everyone at the party on the same scale, making it easier to spot the party animals.
Alright, Data Ninjas, you've now embarked on a thrilling adventure through probability distributions. Remember, probability distributions are your fearless guides, leading you through the tangled jungle of data spread and making you the ruler of uncertainty!
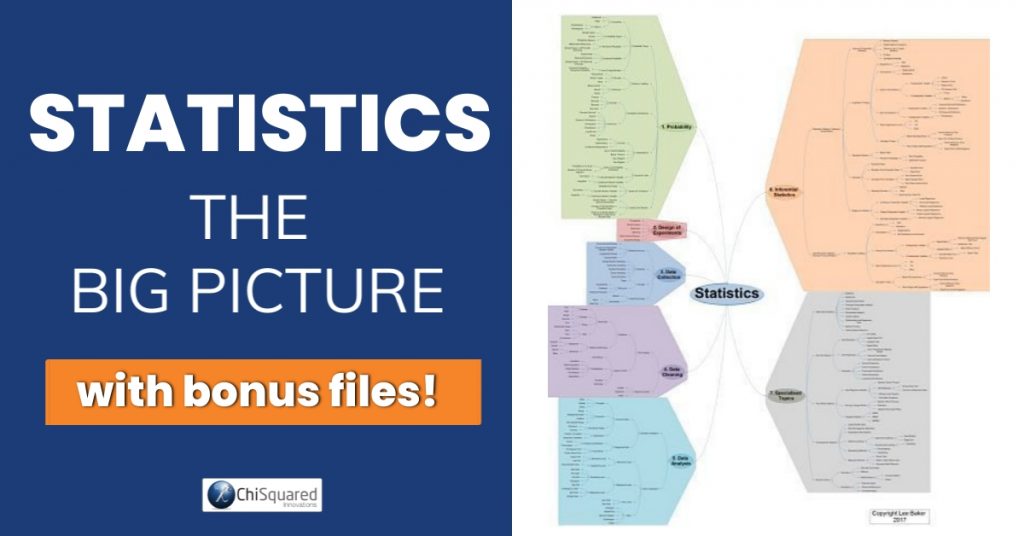
How to do Statistics - Do you know all 7 parts of the statistics universe? #statistics #datascience @chi2innovations
Statistical Inference: Making Informed Decisions with Probability Theory
Alright, Data Ninjas, it's time to sharpen those decision-making skills and channel your inner probability warrior. Brace yourselves as we dive into the captivating realm of statistical inference. It's like having a crystal ball that guides you in making informed choices based on data.
From Sample to Population: Making Bold Leaps
Picture this: you have a sample of data, but you want to make conclusions about the whole population. Statistical inference is here to save the day, helping you make bold leaps from the sample to the bigger picture. It's like peering into a bag of M&Ms and predicting the colour distribution of the entire factory's output.
Confidence Intervals: Embracing the Margin of Error
Ah, confidence intervals, the safety nets of statistical inference. They're like those warning signs at construction sites, indicating a margin of error in your estimates. With probability theory by your side, you'll construct these intervals to capture the true parameter values with a certain level of confidence. It's all about acknowledging the uncertainty!
Testing the Waters: Hypothesis Testing Unleashed
Data Ninjas, get ready to play detective with hypothesis testing. It's like being Sherlock Holmes, investigating claims and uncovering the truth buried in your data. With probability theory as your trusty sidekick, you'll challenge assumptions, gather evidence, and put those bold claims to the test.
p-Values: The Rebel Metrics of Significance
Enter the notorious p-values, the rebels of statistical inference. They're like those rebels at a party, stirring up controversy and challenging conventions. These little metrics measure the strength of evidence against the null hypothesis. But remember, they're not the be-all and end-all. They're just one piece of the puzzle in your quest for statistical significance.
Alright, Data Ninjas, you've just taken a big leap into the world of statistical inference. Remember, statistical inference is your secret weapon, empowering you to make informed decisions based on data and slay the dragons of uncertainty!
Hypothesis Testing: Using Probability Theory to Evaluate Claims
Alright, Data Ninjas, it's time to put on your detective hats and play the thrilling game of hypothesis testing. Consider yourself the judge, jury, and executioner of statistical claims. With probability theory as your trusty magnifying glass, you'll uncover the truth hidden within your data.
The Basics: What's the Big Deal with Hypotheses?
Before we jump into the nitty-gritty, let's talk about hypotheses. They're like bold statements begging to be scrutinized. You have your null hypothesis, the status quo, and your alternative hypothesis, the rebel with a cause. It's a clash of ideas, and you're the referee, using probability theory to decide who takes home the trophy of statistical significance.
Gather Your Evidence: Data and Test Statistics
Here's where the fun begins. You gather your data, ready to unleash the power of probability theory. Test statistics, like detectives, help you assess the strength of the evidence against the null hypothesis. They're like those crime scene clues that guide you towards the truth. The bigger the test statistic, the more suspicious you become.
p-Values: The Mysterious Metrics of Significance
Enter the enigmatic p-values. They're like mystical creatures that assign a numerical value to your evidence. They tell you how likely it is to observe the data you have if the null hypothesis is true. It's like a secret language only probability theory can decipher. But remember, p-values are just one piece of the puzzle. Don't let them dictate your entire decision-making process.
Making the Call: To Reject or Not to Reject?
Data Ninjas, it's judgment time. You've gathered your evidence, calculated your p-value, and now it's decision-making o'clock. If the p-value is low (smaller than your chosen significance level), you unleash your inner rebel and reject the null hypothesis. But if it's high, you embrace the status quo and fail to reject it. It's a nail-biting moment, where probability theory helps you draw conclusions and make confident claims.
Alright, you're now equipped with the knowledge to tackle hypothesis testing like seasoned detectives. Remember, hypothesis testing is your superpower, enabling you to evaluate claims and separate fact from fiction in the intriguing game of data!
Sampling Techniques: How Probability Theory Supports Data Collection
Get ready to unravel the mysteries of sampling techniques and how probability theory comes to the rescue in data collection. Think of it as a treasure hunt where you use your cunning and probability prowess to gather valuable data.
Sampling 101: Diving into the Ocean of Data
Before we delve into the techniques, let's talk about the big picture, shall we? Sampling is like dipping your toes into the vast ocean of data, aiming to capture a representative portion without drowning in information overload. It's about selecting a sample that mirrors the characteristics of the larger population. You're like a data surfer, riding the waves of probability to find that perfect sample.
Simple Random Sampling: A Lucky Dip into the Data Pool
Picture this: you have a pool filled with data, and you want to dip your hand in and grab a sample. Simple random sampling is your ticket to fairness and randomness. It's like closing your eyes, swirling your hand in the pool, and pulling out a handful of data points. Every data point has an equal chance of being selected, just like a lucky dip at a fair.
Stratified Sampling: The Art of Balancing Act
Data Ninjas, prepare to strut your balancing skills with stratified sampling. It's like being a tightrope walker, meticulously dividing your data into homogeneous groups and then sampling from each group. This technique ensures representation from all corners of your data world, like making sure every flavour of pizza gets a fair chance at the tasting party.
Cluster Sampling: The Art of Group Hugs
Sometimes, your data comes in clusters, like a group of penguins huddling together for warmth. That's where cluster sampling comes in. Instead of sampling individual penguins, you gather entire clusters to represent the population. It's like giving each penguin group a big ol' group hug, ensuring all their quirks and characteristics are captured in your sample.
Systematic Sampling: Embracing Order in the Chaos
Data Ninjas, get ready to bring some order to the chaos with systematic sampling. It's like organizing a library, where you select every nth book on the shelf. You establish a system and follow it diligently, sampling data points at regular intervals. It's efficient, straightforward, and ensures you don't miss any hidden gems in your data treasure trove.
Alright, you've now mastered the art of sampling techniques with the help of probability theory. Remember, sampling techniques are your trusty companions, guiding you to collect data with finesse and precision in the grand adventure of data exploration!
Bayesian Statistics: Incorporating Prior Knowledge and Probability Theory
Get ready to tap into the mysterious realm of Bayesian statistics, where prior knowledge meets probability theory in a tantalizing dance. It's like a fusion of ancient wisdom and modern analysis, giving you the power to make sense of data like never before.
The Bayesian Way: A Different Path to Enlightenment
Forget what you thought you knew about statistics. Bayesian statistics is here to challenge the traditional ways of thinking. It's like stepping into a parallel universe where you embrace uncertainty and update your beliefs as new data arrives. Bayesian inference is a journey of discovery, where you incorporate prior knowledge and probability to unveil the true nature of your data.
Priors: Your Key to Unlocking the Bayesian Universe
In the realm of Bayesian statistics, prior knowledge reigns supreme. Priors are like the foundation upon which you build your analysis. They represent your beliefs about the parameters before observing any data. It's like having a gut feeling, a hunch about the world, and using it to guide your decision-making process. Priors are your wise companions in the Bayesian world, shaping your posterior beliefs.
Posterior: The Updated Truth Revealed
The posterior represents your updated beliefs about the parameters after observing the data. It's a blend of your prior knowledge and the evidence at hand. It's like a phoenix rising from the ashes of prior knowledge and new data.
Bayesian statistics gives you the power to continuously refine and update your understanding of the world.
Markov Chain Monte Carlo: Taming the Beast of Integration
Integration, the bane of every statistician's existence, meets its match with Markov Chain Monte Carlo (MCMC). It's like conquering a wild beast by taking a series of small steps. MCMC algorithms sample from the posterior distribution, allowing you to estimate complex quantities and make inference even when analytical solutions are elusive. It's like having a magical compass to navigate the treacherous waters of integration.
Alright, Data Ninjas, you've just scratched the surface of the fascinating world of Bayesian statistics. Remember, Bayesian statistics is your gateway to incorporating prior knowledge and unleashing your inferential powers in the vast landscape of data analysis!
Regression Analysis: Predicting Outcomes with Probability Theory
Get ready to step into the realm of regression analysis, where you wield the power of probability theory to predict outcomes like a mystical fortune teller. It's like peering into a crystal ball, using the patterns in your data to uncover hidden insights and make accurate predictions.
The Building Blocks: Understanding Regression
Before we dive into the depths of regression analysis, let's lay the groundwork, shall we? Regression is like building a bridge between two variables, one playing the role of the predictor and the other the outcome. It's like Sherlock Holmes and Dr. Watson, investigating the relationship between variables and deducing how one influences the other. Regression is your trusty sidekick in uncovering those hidden connections.
Linear Regression: Simplicity at Its Finest
Linear regression assumes a linear relationship between variables, making it the bread and butter of predictive modelling. You'll use probability theory to estimate the slope and intercept, allowing you to draw a line that best fits your data. It's like connecting the dots and having a line that guides your predictions.
Multiple Regression: Expanding Your Predictive Arsenal
Multiple regression is like assembling an Avengers team of predictors to supercharge your predictions. You'll incorporate multiple predictor variables, each with its own impact on the outcome. It's like having a crew of superheroes, each contributing their unique powers to save the day. With probability theory, you'll estimate the coefficients and uncover the individual and combined effects of your predictors.
Prediction Intervals: Embracing the Uncertainty
Prediction intervals are your shields against uncertainty. They're like protective bubbles that acknowledge the inherent variability in your predictions. With probability theory as your guide, you'll construct these intervals to capture the range of possible outcomes with a certain level of confidence. It's all about understanding that even the best predictions come with a margin of error.
Alright, you've now unlocked the power of regression analysis. Remember, regression analysis is your key to predicting outcomes and unravelling the mysteries hidden within your data.
Applications of Probability Theory in Real-World Data Analysis
It's time to take off your training wheels and dive into the thrilling world of applying probability theory to real-world data analysis. You've learned the basics, mastered the techniques, and now it's time to unleash your skills in the wild.
Risk Assessment: Navigating the Hazards of Uncertainty
Data Ninjas, welcome to the world of risk assessment, where probability theory acts as your personal compass. You'll tackle questions like "What's the probability of an event occurring?" and "What are the potential consequences?" Probability helps you quantify uncertainties, make informed decisions, and take calculated risks. It's like having a crystal ball that helps you navigate the hazards of the unknown.
Reliability Analysis: Putting Trust to the Test
In the realm of reliability analysis, probability theory becomes your most trusted ally. You'll assess the durability and dependability of systems, products, or processes. It's like being a detective, investigating the likelihood of failure or breakdown. Probability models, such as the infamous bathtub curve, guide you in understanding the life cycle of components and ensuring reliability in the face of uncertainty.
Quality Control: Separating the Good from the Bad
When it comes to quality control, probability theory is your secret weapon against subpar products. You'll use statistical techniques to inspect, measure, and analyse data to ensure that your products meet the highest standards. Probability helps you identify anomalies, detect defects, and maintain the quality that your customers deserve. It's like being a superhero, saving the day from the clutches of shoddy craftsmanship.
Forecasting: Peering into the Crystal Ball of the Future
Forecasting allows you to predict future trends, demand, or outcomes based on historical data patterns. You'll use probabilistic models to estimate probabilities, simulate scenarios, and anticipate what lies ahead. It's like being a fortune teller, making educated guesses about what the future holds.
Discover more in this blog series...
Embracing Probability Theory: A Fundamental Tool for Data Analysis and Statistical Insights
Probability: Your Secret Weapon
Throughout this blog post, we've uncovered the essential role that probability theory plays in your data analysis adventures. Probability is like your trusty sidekick, helping you navigate the treacherous paths of uncertainty, making informed decisions, and extracting meaningful insights from your data. It's the secret weapon in your arsenal that enables you to cut through the noise and uncover the hidden truth.
The Art of Inference
You've delved into the art of inference, using probability theory to draw conclusions, make predictions, and evaluate claims. You've witnessed the magic of hypothesis testing, the power of statistical inference, and the elegance of regression analysis. With each technique, you've added a new tool to your belt, expanding your capabilities to wrangle data and extract valuable insights.
From Theory to Practice
But remember, probability theory is not just about abstract concepts and formulas. It's a practical tool that empowers you to tackle real-world challenges. You've explored applications like risk assessment, reliability analysis, quality control, and forecasting, using probability theory to solve practical problems and make data-driven decisions.
The Journey Continues
As you embark on the next phase of your data analysis journey, always keep in mind the fundamental role that probability theory plays. It's your guiding light, your compass in the vast sea of data. Embrace uncertainty, navigate complexities, and let probability be your trusted companion.
Keep exploring, keep learning, and remember that the world of data analysis and statistics is constantly evolving. Your thirst for knowledge will take you far.
Statistics - The Big Picture: PDF Download
In Statistics - The Big Picture I delve deep into each of these 7 sections so you can see where all the different parts of stats fits in relation to everything else. It helps you to plan every element of your study from beginning to end so you can plot a route through The Big Picture, leaving nothing to chance in your research.
If you want your very own Statistics - The Big Picture to download and keep, you can get an Ultra HD pdf right here (with 50% off!):


