Ever been deceived by stats? In this blog post we teach you the tools of the trade of the statistical conmen so you'll be better able to spot when someone is trying to con you. Ready? OK, let's go...
More...
Disclosure: As an Amazon affiliate, we may earn an affiliate commission for purchases you make when using the links to books on this page.
Here is an advertisement that was recently placed in the New York Times to motivate people to go and get screened for colon cancer:
The Early Signs of Colon Cancer: |
|---|
You feel great |
You have a healthy appetite |
You're only 50 |
Wow! Scary, isn’t it?
Of course it is! That’s the whole point of the ad – scare the crap out of people (pun intended) and watch as the number of patients on your books shoot through the roof.
The advert suggests that there is an association between feeling great and having colon cancer, between having a healthy appetite and colon cancer, and being 50 years old and having colon cancer.
But is the advert true? Do these associations really exist?
Of course not - they lied!
Well, not quite, but they were being extremely biased. Some people that were diagnosed with colon cancer would have been 50, feeling great and had a healthy appetite, so although it wasn’t a lie it certainly wasn’t the truth, the whole truth and nothing but the truth, M’lud.
87.3% of all statistics are made up on the spot...
How to Lie With Stats
(and get away with it…)
This series of blogs is not to teach how to deceive, but rather to give you an understanding of how others are deceiving you. If you know and understand the conster’s tricks of the trade, you’ll be better able to spot when he’s trying to pull a fast one.
And remember – an outright lie will get discovered very quickly, but a deception based on the numbers is like a well-practiced card trick – it’ll fool most of the people most of the time.
Politicians and corrupt analysts already know these tricks. For every one else, learning them is just basic self defence…
Related Books
In-Built Bias
So, getting back to the ad above, what sleight of hand did they use to try and pull the wool over your eyes?
Obviously the majority of cases weren’t being represented by the advert, such as colon cancer patients that:
They deliberately biased their data to fit their purpose, which was to use sensationalist headlines to boost the number of people getting checked for colon cancer in their clinic.
Analysing data to find associations between data variables is very common – not just in healthcare data analysis, but across all sectors – and it’s a classic way of using data to mislead, so let’s go through it step-by-step…
2x2 Contingency Tables
Let’s say we’re looking into the hypothesis that younger people with colon cancer are more likely to suffer from their disease spreading to other organs (metastatic disease) than older colon cancer patients.
If we have a dig around in our fictional colon cancer data archives we might find some data to start us off with (table, below left):

Our colon cancer data: Raw Data on the left, Clean Data on the right
If we decide that ‘younger’ becomes ‘older’ at 50 years of age, then we can convert the continuous values of our Age variable into ordinal categories of ‘Under 50’ and ‘Over 50’ (table, above right).
To analyse these data we need to arrange them in a contingency table (aka cross classification table, frequency table or confusion matrix), so we add up all the number of rows that contain:
and put them in a 2x2 table like this:
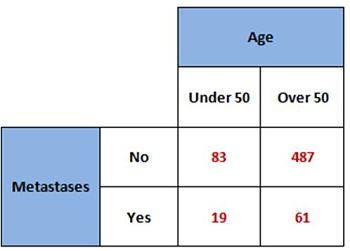
Our colon cancer data arranged in a 2x2 contingency table
So what can we say about these numbers?
We could take the smallest and largest cell counts (bottom left and top right) and give them some context, such as:
- Very few patients under 50 years old suffer from colon cancer metastases
- Most patients over 50 years old do not suffer from colon cancer metastases
Well, that’s not very sensationalist is it? Come on, we can do better than that – let’s take the row ratios and see what we can come up with:
- The over 50s are 6 times as likely (487/83) to not get colon cancer metastases as the under 50s
- The over 50s are 3 times as likely (61/19) to get colon cancer metastases as the under 50s
Hmm, not very inspiring. Let’s try again with the column ratios:
- The under 50s are 4 times less likely (83/19) to get colon cancer metastases as not
- The over 50s are 8 times less likely (487/61) to get colon cancer metastases as not
Well I don’t think we’ve found the great deception yet, but the difference in those ratios (6 versus 3 and 8 versus 4) is interesting. Perhaps we can dig a bit deeper into these ratios and see what they can tell us…
Expected Chi-Squared Values
So far we’ve looked at the numbers in isolation and haven’t managed to find the killer catch-line that motivates people to go running and screaming to their local cancer centre to get tested.
Perhaps if we figure out what we would expect to get and then compare the actual numbers to these we might discover something.
Our first step then would be to find a way of calculating the expected value for each cell. From this number, we can figure out by how much our actual values deviate from what would be expected by chance.
Here’s how to calculate expected values:
The Column Sums, Row Sums and Table Totals are:
- C1: 83 + 19 = 102
- C2: 487 + 61 = 548
- R1: 83 + 487 = 570
- R2: 19 + 61 = 80
- Total: 83 + 487 + 19 + 61 = 650
So the expected values in our example would be:
- Top left cell: C1*R1/Total = (102*570)/650 = 89.4
- Top right cell: C2*R1/Total = (548*570)/650 = 480.6
- Bottom left cell: C1*R2/Total = (102*80)/650 = 12.6
- Bottom right cell: C2*R2/Total = (548*80)/650 = 67.4
This is what our table of expected values would look like:
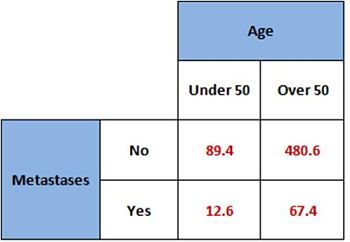
2x2 table of the expected values of our colon cancer data
So now we have a way to be able to compare the actual values with what we should expect by chance. If they differ we should be able to detect that.
Related Books
Chi-Squared Cell Values
To detect whether actual and expected values differ, it’s not quite as simple as performing a straight-forward subtraction.
Oh no, we are statisticians, we don’t do things the easy way…
Here’s what we do instead:
For each cell, take the difference between the observed and expected values. We call these the residuals.
Make a note of which residuals are negative (i.e. there are fewer cases than expected) – we’ll need these later.
Now square each residual and divide by its expected value.
For those of you that like to see these things in maths notation, here is what it looks like:
This equation is known to be a little inaccurate, so if you want to be a bit more precise you could apply a correction factor to it (Yates’ correction), like this:

Now add back in the signs of the residuals that you previously took a note of. I call these the Chi-Squared cell values and they tell you whether and by how much the observed values differ from those expected.
Our table of Chi-Squared cell values (with Yates’ correction) would look like this:
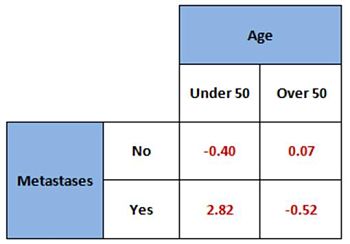
2x2 table showing the Chi-Squared cell values
Looking at the table, there is one value that clearly stands out from the rest.
The value in the bottom left cell is large compared with the other 3 values. I call this the critical cell, and is the cell that differs most from what we expect to find by chance. It is this cell that is most likely to account for any association that we find, if any.
As it is positive it tells us that there are more colon cancer patients under 50 years of age with metastatic disease than we expect.
Aha! We’re getting closer to discovering our sensational headline now.
Interesting though how the smallest number in the table seems to be the most important…
Chi-Squared Test
If we add up all these Chi-Squared cell values (ignoring the sign), then we get the Chi-Squared value for the whole table. This is the number that we get when we run a Chi-Squared Test on our observed values, and tells us whether there is evidence of an association between the pair of variables being studied.
For our table:
Oh buggrit. This suggests that there is no evidence of an association between age and metastatic spread of colon cancer (p is larger than 0.05), that we observed no significant difference between the metastatic spread in young colon cancer patients compared with older patients.
Looks like we’re not going to get our deceptive headline after all.
Well hold on a sec, the p-value is so close to the arbitrarily chosen 95% significance level that if we sneakily ‘accidentally on purpose’ omit a couple of strategically important patients from the analysis, we might just be able push our p-value over the line…
I certainly wouldn’t advocate doing that – that would be fraudulently misrepresenting the data and could get you hauled in front of a Research Ethics Committee.
Incidentally, a few years back I did some analysis for a good friend (name withheld to protect the guilty!) who wanted me to check some of his results. Despite having precisely the same data and having used the same statistical tests, I was unable to verify some of the associations. When I asked why some were statistically significant in his analyses where they were not in mine, he replied ‘well, if I exclude these 2 patients from the analysis the p-value becomes significant’. On enquiring why those patients should be excluded from the analysis, he said ‘because when I do the p-value becomes significant…’.
Oh dear…
What he could have done, of course, was to have chosen a different statistical test, and then he could have argued till the cows come home about the merits of one statistical test over another – a favourite pastime of statisticians...
Fisher’s Exact Test
The Chi-Squared Test p-value is only an approximation, and although Yates’ correction is more accurate it usually over-corrects and gives a p-value that is too large (too conservative).
An alternative to the Chi-Squared Test would be to calculate the Fisher’s Exact Test.
I’m not going to go through the calculation for the Fisher’s Exact Test because it’s quite complicated, but here is the result of running our contingency table through the Fisher’s Exact Test:
Aha! Statistical significance.
So by being sneaky and choosing a different test we have managed to manipulate the result that we want. Except that the Fisher’s Exact Test is usually a better choice than the Chi-Squared Test anyway.
Better still, the Fisher’s Exact Test is known to be too conservative (gives a p-value that is too large), so we can run a Fisher’s Exact Test that incorporates Lancaster’s Mid-P correction (a similar procedure to that of Yates’ correction on the Chi-Squared Test):
There’s also something else that we can do to ‘fiddle’ our p-value and get it even smaller.
When we run a Fisher’s Exact Test we are usually confronted with 3 different p-values; the Left tail, Right tail and 2-tail p-values. Analysing our table, we would get these results (I’ve included results of other tests here for comparison):
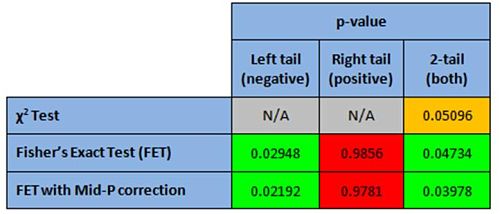
Statistical results coded with traffic-light colours; green = significant (<0.05), red = not significant (>0.10), amber = marginal (between 0.05 and 0.10)
So which one should we use?
As we’re trying to be as unscrupulous as possible, we use the one with the lowest p-value!
Of course, the correct thing to do would be to choose the one that corresponds with our hypothesis.
If we had a hypothesis before we ran the statistical tests, then we can legitimately ignore the 2-tailed p-value and choose either the right-tailed or left-tailed p-value.
Ah yes, but which one?
Our hypothesis was that there would be more young people with colon cancer metastases than would be expected by chance. If this is true then the value in the bottom left cell of our contingency table would be higher than expected by chance and would have a large positive chi-squared cell value.
This corresponds to a negative association between the variables (when one variable goes up the other comes down) and we should choose the left-tailed p-value:

Well, what a happy coincidence – the left-tailed p-value is a lot smaller, so our prior hypothesis appears to be correct and younger colon cancer patients may well be more likely to get metastases.
The p-value that we would quite happily have chosen had we elected to be deliberately devious just happens to be the most appropriate p-value anyway.
Well now you know a different way that results can be manipulated – people often use the statistical test that magically gives them the result that they want.
Actually, this is done quite a lot in scientific research, albeit unwittingly. Researchers can often be unaware of which statistical test they should be using, so they choose poorly. I once worked with a researcher who admitted that they had no idea what they were doing with stats, so they ‘just hit buttons randomly until I get a p-value’, and then publish it in a paper.
Thankfully this is quite rare but has been known to happen – and published in major journals.
Effect Size – Odds Ratio
So, with a p-value of 0.022, what we can say here for our sensationalist headline is that ‘there is a really strong association between age and metastatic colon cancer’.
Some might even go the whole hog and say that ‘there is a really strong correlation between age and metastatic colon cancer’, suggesting that the younger you are the more likely that your colon cancer will metastasise to other organs.
Sadly (for the would-be deceiver), neither of these statements is correct.
The Chi-Squared and Fisher’s Exact Tests are statistical hypothesis tests. You make a hypothesis about whether the predicted association is likely to have occurred by chance, and the answer is either ‘Yes’ or ‘No’:
The p-value gives you evidence whether an association exists.
It does not give you any information about the strength of the association.
If you want to find out about the nature of the association then you need to determine the size of the effect that you’re measuring.
For the 2x2 contingency table the easiest and most appropriate way to find the effect size is to calculate the Odds Ratio.
Here’s how to calculate it:
1. The odds of having metastases in the Under 50s is:
- Odds = 19/83 = 0.229
2. The odds of having metastases in the Over 50s is:
- Odds = 61/487 = 0.125
3. The ratio of these two odds is:
- Odds Ratio = 0.229/0.125 = 1.828
This means that you would be almost twice as likely to suffer from metastases if your colon cancer was diagnosed when you were under 50 years old, compared to if you were over 50 when you were diagnosed.
If you were writing this for an academic paper, your text might look something like this:
“The odds of colon cancer metastases in the Under 50 cohort was twice that in the Over 50 cohort (OR: 1.83, 95% CI: 1.04-3.22), and was statistically significant (p = 0.022; 1-tailed Fisher’s Exact Test with Lancaster’s Mid-P correction).”
Using the result for a new advert, the headline might go like this:
Colon cancer screening: |
|---|
Colon cancer is twice as likely to spread to your other organs if you’re under 50 years old. |
Get Checked Today! |
OK, so it’s not as scary as the original and doesn’t have the same WOW factor, but you’ll have managed to keep your integrity and you’ll have published something based on real analyses that accurately reflects the truth.
Or did you?
Have another look at the result.
Are older patients less susceptible to colon cancer metastases because of their age? Does the age of the patient stop cancer cells from splitting away from the main tumour and travelling to another site?
Of course not, that would be ridiculous.
Congratulations, you’ve just deceived your audience!
And the crime?
An incomplete set of analyses.
Clearly there is some other factor that affects the result, and it’s your job to find it. Perhaps you could investigate whether the type of tumour is different (more aggressive) in the younger patients.
Essentially you need to find out which of your associations are independent of other factors, and here begins your time-intensive research and analysis programme.
Well, you didn’t think it would all be over with just one p-value did you?
How to Lie With Numbers, Stats and Graphs
A Box Set Containing Truth, Lies & Statistics and Graphs Don't Lie

Truth, Lies & Statistics and Graphs Don't Lie are two of our biggest selling books – and by far our funniest!
In these eye-opening books, award-winning statistician and author Lee Baker uncovers the key tricks of the trade used by politicians, corporations and other statistical conmen to deceive, hoodwink and otherwise dupe the unwary.
Discover the exciting world of lying with data, statistics and graphs. Get this book, TODAY!

