If you want to know how to do statistics, you'll need to know how to navigate through statistics to create a plan-of-action for your study. Where do you start? Should you bury your head in the sand and go out and collect your data without having a strategy on how to analyse it?
That's probably not a good way to start - and yet that's exactly where most people do start!
And three years later, when their thesis or report is overdue, they take their data to a statistician and say 'I just need a p-value for my paper'.
Little do they know that they need a miracle to rescue their study!
Fortunately, there are ways of creating a coherent plan-of-action for your next study, and all you need are a process, a strategy and a nice, big diagram of The Big Picture of statistics!
Here I'm going to give you all three!
More...
Disclosure: This post contains affiliate links. This means that if you click one of the links and make a purchase we may receive a small commission at no extra cost to you. As an Amazon Associate we may earn an affiliate commission for purchases you make when using the links in this page.
You can find further details in our TCs
Let’s face it, stats is hard.
Or is it?
Over the years I’ve taught statistics to hundreds of people, and every one of them had 2 things in common:
- 1they all said they didn’t understand statistics
- 2they all had the light-bulb moment when they suddenly ‘got it’

Pin it for later
Need to save this for later?
Pin it to your favourite board and you can get back to it when you're ready.
But from time to time one of them would say ‘yeah, but that’s only one small part of stats – how does it fit into the bigger picture?’.
I wanted to point them to some resource and say ‘here you go, here it is, the big picture – this is how it all fits together’, but I never found such a resource.
So I decided that I was going to create it.
So that’s what I’ve done.
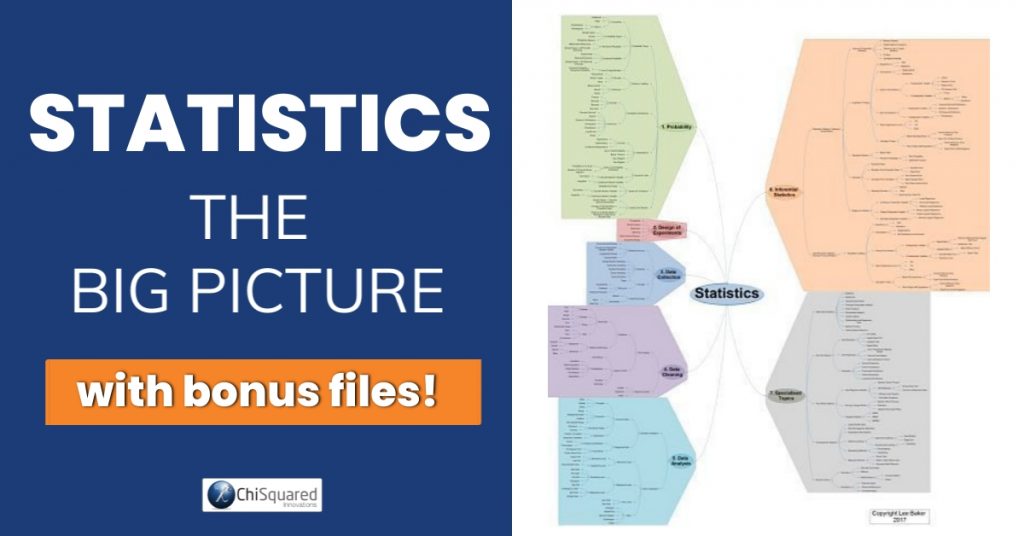
It took me months, but I’ve researched all the little nooks and crannies of the statistics universe and I’ve created a mind map of what stats looks like when you pull it all together, and here it is (tip: click through to get 50% off):
As you can see, there's a HUGE amount of information in there, so it will take you quite a bit of study time to get to grips with it all.
We have an exclusive video course dedicated to teaching all of this in The Hive, but for now, let's have a look at The Big Picture to understand a bit more about it.
The 7 Sections of Statistics
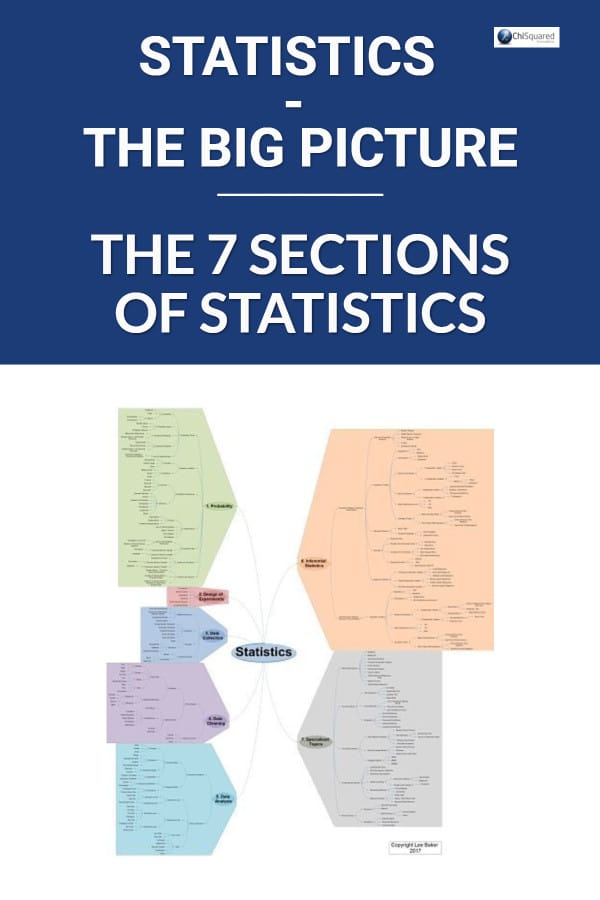
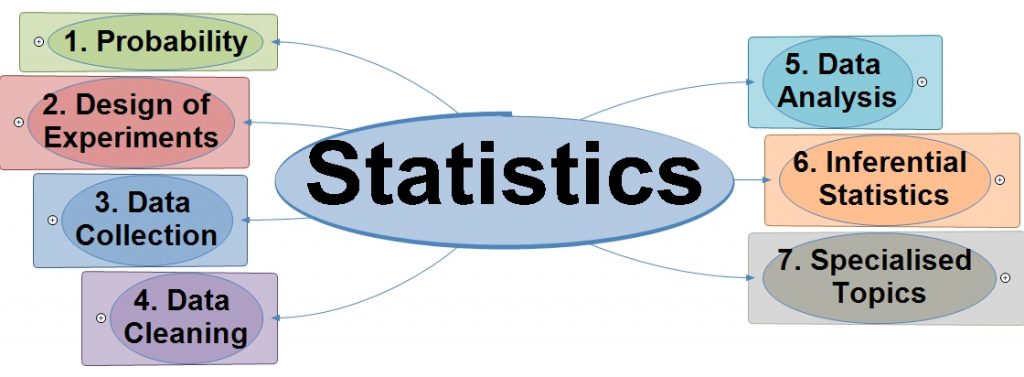
Statistics has an order, a flow, and if you want to know how to do statistics, you'll need to understand the flow. When you break it all down to its simplest, there are only 7 sections of statistics.
Yes, really!
And here they all are:
I'm not going to go into any great detail in any of these sections in this blog post, because - apart from making it the longest blog post in history - we have the course for that.
What I will do here, though, is explain how you can use Statistics - The Big Picture to create a strategy for all of your analyses, so you can plan your study from beginning to end.
Doing this gives you the confidence to know that you've considered every tiny little detail, you know exactly how to do statistics and that you're not going to get a shock from your statistician in 3 years time when he tells you your dataset isn't fit-for-purpose and needs to be scrapped!
And yes, I've had to tell researchers this many times. Far too many...
Statistics Has Order
You wouldn't do any analyses on your data before you've cleaned it would you?
And yet, so many people do! I've lost count of the number of times that I've received a dataset that had already had some analysis done on it, and when I checked it had errors, spelling mistakes, missing datapoints and all sorts of problems.
So you can see that statistics has an order to it, and if you know what that order is you can create a chronological plan to make sure that everything gets done in the right order.
Let's go through the 7 sections...
How to do Statistics - Do you know all 7 parts of the statistics universe? #statistics #datascience @chi2innovations
How to do Statistics:
1. Probability
Yeah, yeah, I know - probability isn't your favourite subject. Well guess what - it's not mine either!
But it's not what you think. It's not all about flipping coins and throwing dice (although there is plenty of that!).
Probability gives us a framework in which we can run experiments in the real world and then compare our results with what we would expect.
One of the most important things here is the concept of Probability Space. Without getting too technical, you can think of this as an imaginary box. Go ahead - close your eyes and picture a box. Now continue reading with your eyes closed.
When you're planning your study you need to make decisions about the data you collect. Let's say you're going to do a study on breast cancer. In this case you would probably only want to collect data on female breast cancers, so with your eyes closed you visualise putting Gender:Female into your imaginary probability box. Then you visualise putting Gender:Male outside your probability box.
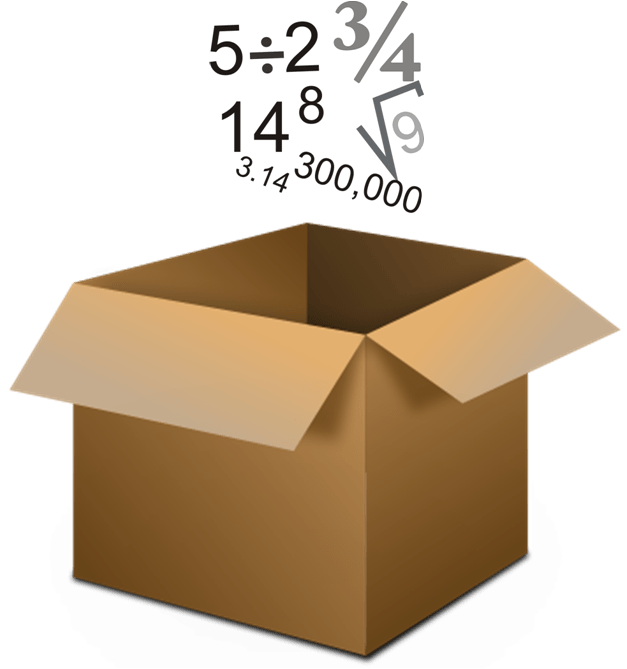
By visualising decisions like these you make better decisions and you remember what you've done. Everything that needs to be in your experiment, put it in the box. Everything that should be excluded, put it outside the box.
The concept of a probability space might by theoretical, but it can be of enormous use when planning your study.
How to do Statistics:
2. Design of Experiments
Do you know the basic principles of designing experiments? If you don't, how do you know how to design them?
Ultimately, all experimental design is based around the principle of comparison. Whether you're going to compare apples with oranges or compare some apples with the same apples some time later, you should know how to design your experiment so that you - and other researchers - can trust your final results.
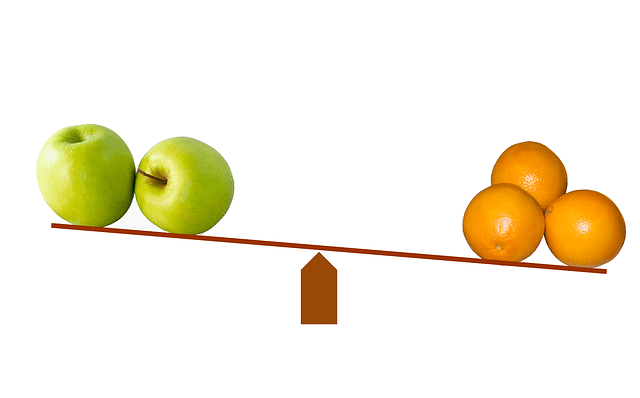
If you don't understand the meaning of 'Triple Blind, Randomised Controlled Crossover Trial', then perhaps you need to learn a little more about how to design experiments...
How to do Statistics:
3. Data Collection
Sounds simple enough - you just go out and collect your data, don't you?
Well, you could do that, but if you don't plan your data collection in enough detail you'll probably introduce bias into your data, and that could invalidate your whole study.
Don't believe me? OK, then, smarty pants, if you sent out a questionnaire asking people just one simple question "do you enjoy filling questionnaires?" do you think you'll get valid results?
Most probably 100% of respondents will answer "yes, I enjoy questionnaires". Is this a result that accurately represents the population at large? Highly unlikely!
I hope you can see that the way you ask your questions can have a huge influence on the data you collect. In the example here, only those few special individuals that enjoy questionnaires will participate (self-selection), while the majority of people will file the questionnaire carefully in the nearest waste paper bin (self-omission).
Ta-daaa! You've just produced a highly biased study!
Clearly there's a lot more to data collection than just collecting data!

How to do Statistics:
4. Data Cleaning
How do you clean your data? Do you scan an Excel spreadsheet spotting errors by eye and correcting them manually as you go along? Do you enjoy Bleeding Eye Syndrome?
Data cleaning may be the least sexy thing you can do with your data, but it's arguably one of the most important.

Data scientists typically spend around 80% of their time cleaning and preparing data, so it's definitely a subject that you need to master.
So why is it that no-one writes books about it then? Because it's messy. And unsexy. And messy. Did I mention that it's messy?
Data cleaning can be a very difficult task if you don't know what you're doing, but it can actually be quite straightforward if you have a good strategy.
Data Cleaning - the least sexy thing you can do with your data #statistics #datascience @chi2innovations
How to do Statistics:
5. Data Analysis
This section is all about getting your hands dirty and understanding your data.
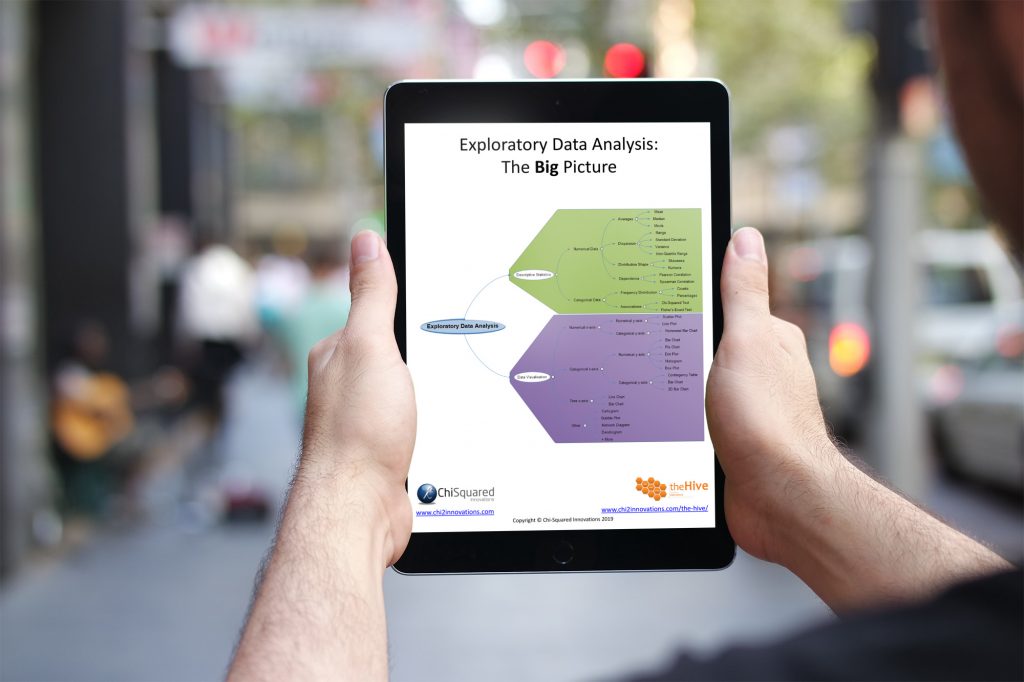
If you want to know how to do statistics, you need to know how to calculate and interpret means, standard deviations, counts, percentages, maximum and minimum values, stuff like that.
You know, all the boring stuff that you tend to do after you've done all the more serious analyses so you can add a little descriptive statistics table into your paper to show that your data are fit-for-purpose.
That's not when to do basic data analysis. You should be doing it early so that you understand your data. What if your data are skewed or you've got outliers? Will that affect the results of the more serious analyses? You bet your sweet tushy it will. So does that mean that you'll have to do your analyses all over again? Yup!
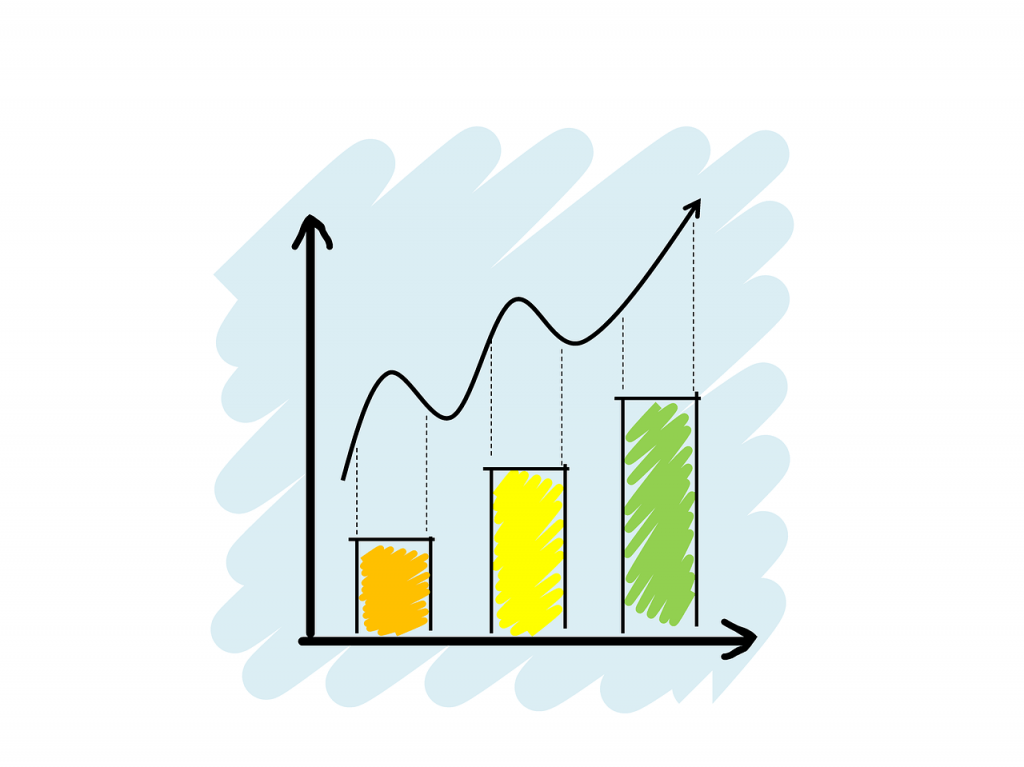
So you see, doing descriptive statistics and getting to know your data shouldn't be an after-thought. It should go right after Data Cleaning and just before Inferential Statistics...
How to do Statistics:
6. Inferential Statistics
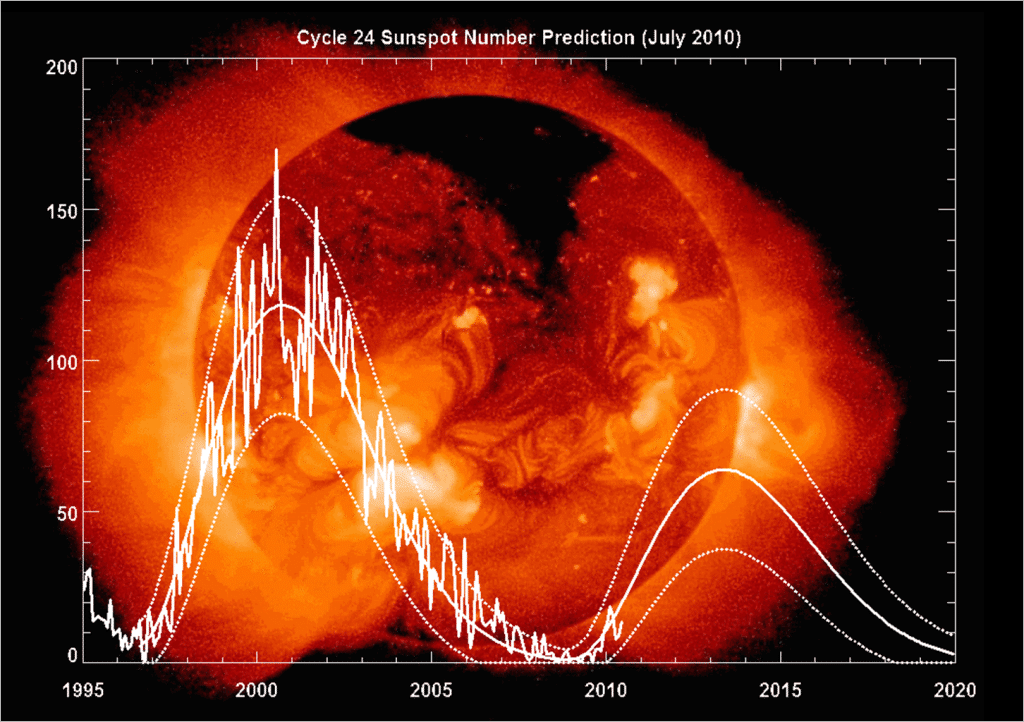
Descriptive statistics tells you what the world looked like at the time you collected your data. Inferential statistics tells you what it will look like in the future. Or, at least, what the future might look like. They do this by modelling the data you have and allowing you to infer from new data.
For example, you might run a regression, which allows you to add a best-fit line to your data and thereby predict an outcome by interpolation or extrapolation.
How to do Statistics:
7. Specialised Topics
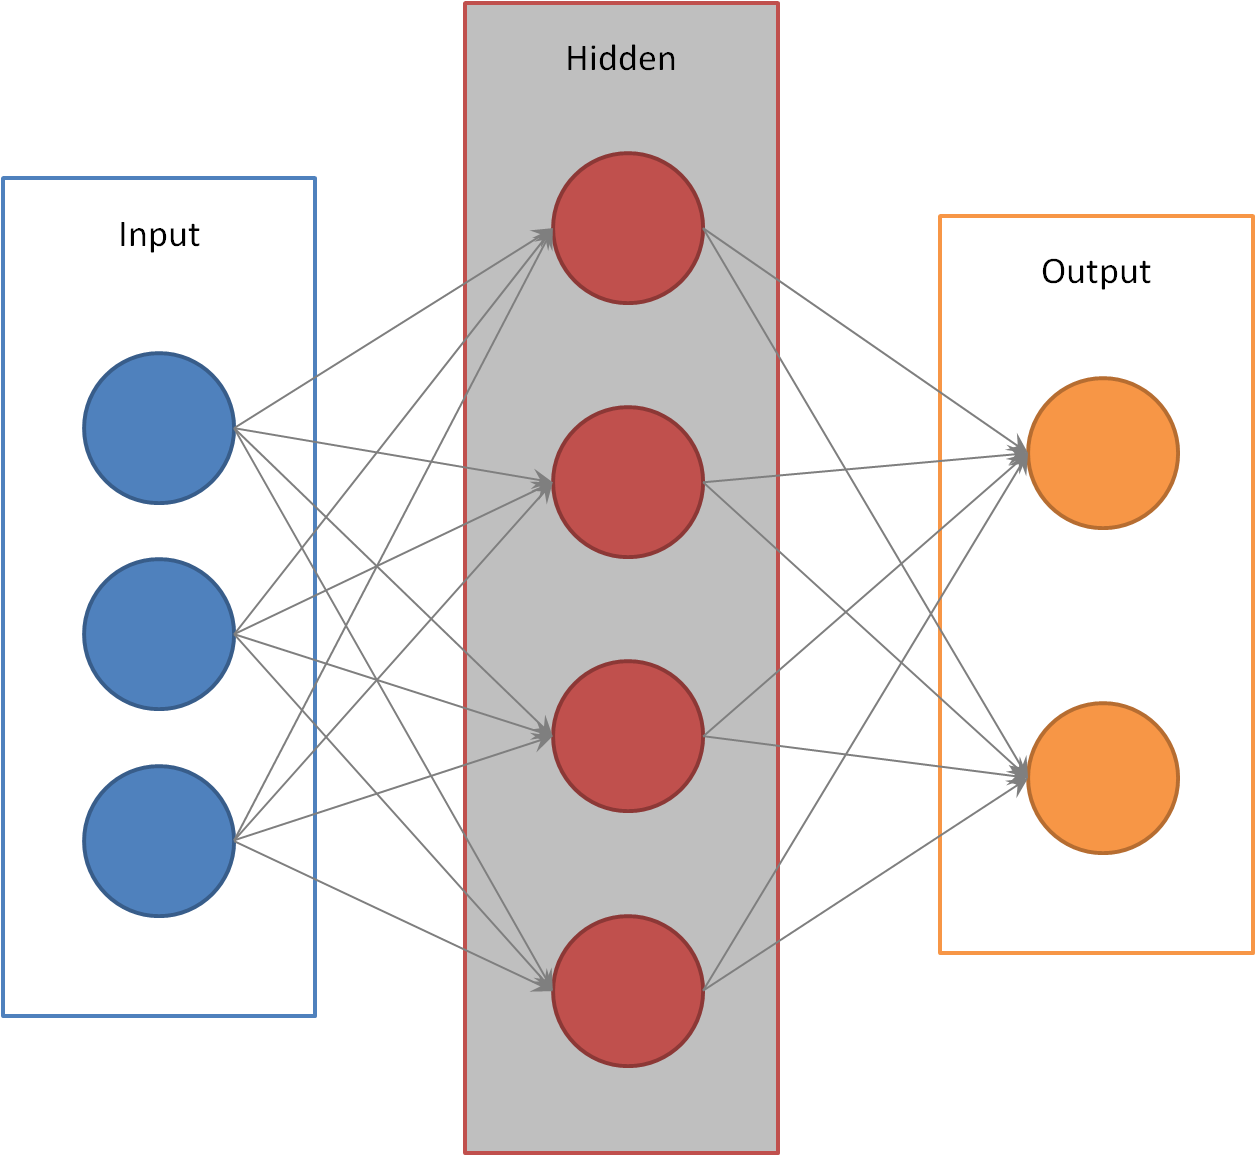
Finally, there are some specialised topics that you would use when 'traditional' statistics starts to fray a little or break down completely. Things like Artificial Neural Networks, Time Series Analysis or Survival Analysis.
Summary
I hope you can see now that statistics has an order, a chronological flow that you must follow.
First you (1) create the framework of your study (Probability). Then you (2) spend time designing it (Design of Experiments) before going ahead and (3) collecting your data (Data Collection), after which you (4) clean it (Data Cleaning).
After this you (5) get to know your data by performing descriptive statistics (Data Analysis). You then (6) follow this up with more serious statistical analysis to allow you to make predictions from it (Inferential Statistics), then perhaps (7) follow up with some more specialised analysis techniques (Specialised Topics).
This is how to do statistics the easy way - the proper way - and you should be able to see from this that if you deviate from this flow that there is the potential to get into difficulties.
I appreciate that Inferential Statistics and Specialised Topics are the sexy bits that you want to get to as quickly as possible, and that Probability and Data Cleaning are coma-inducing (so much so that you'd rather skip them altogether), but if you do things out of order or miss sections out you're storing up trouble for later.
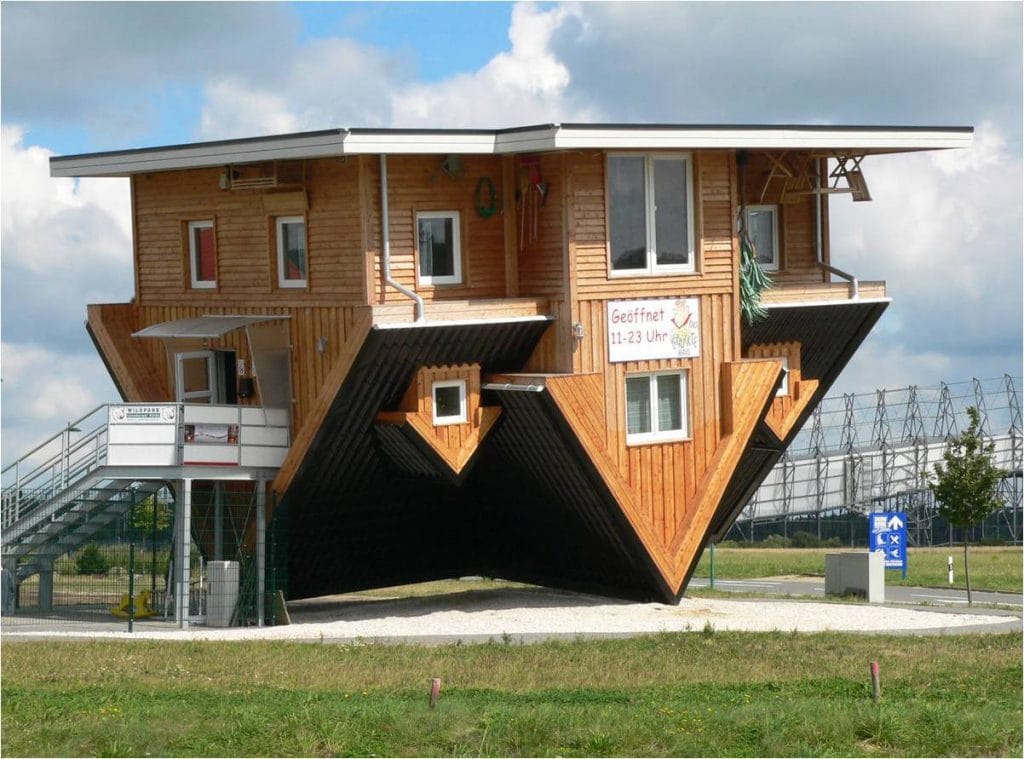
You wouldn't build a house without putting down solid foundations would you? Well that's exactly what you do whenever you skip Probability or Design of Experiments.
When you get the fundamentals of Data Collection or Data Cleaning wrong, it's like putting up the walls of your house without checking that everything is straight and won't fall down on top of you.
And leaving Data Analysis until later is like building a house with your eyes closed - all things considered, it's probably not a good idea...
Statistics - The Big Picture: PDF Download
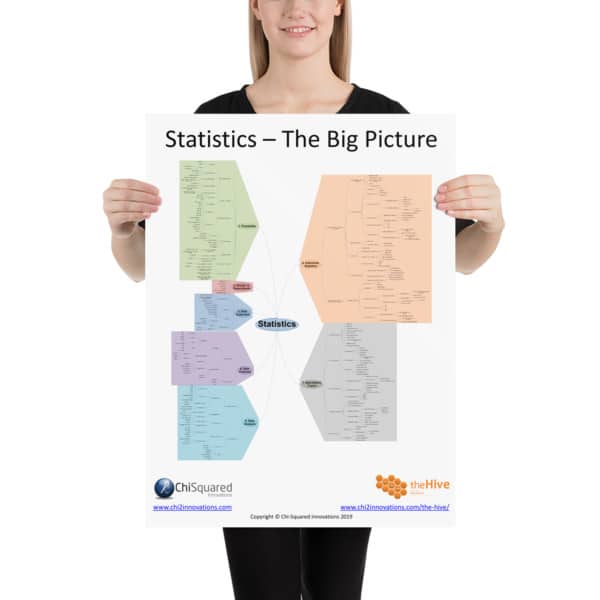
In Statistics - The Big Picture I delve deep into each of these 7 sections so you can see where all the different parts of stats fits in relation to everything else. It helps you to plan every element of your study from beginning to end so you can plot a route through The Big Picture, leaving nothing to chance in your research.
If you want your very own Statistics - The Big Picture to download and keep, you can get an Ultra HD pdf right here (with 50% off!):

